DescriptionTable DataChart and Figure Data
Ch.5 INCOME
Ch.5 INCOME
SY 2017 Table 5.1 Household Income in Year before Census, CNMI: 1980 to 2000
Statistical Yearbook 2017 CNMI CSD
Note: All values in current dollars
| Income Level | 2010 | 2000 | 1995 | 1990 | 1980 |
|---|---|---|---|---|---|
| Source: U.S. Census Bureau and 1995 CNMI Census | |||||
| Less than $2,500 | $903 | $611 | $1,501 | $362 | $343 |
| $2,500 to $4,999 | $558 | $307 | $569 | $374 | $515 |
| $5,000 to $9,999 | $2,529 | $1,961 | $1,609 | $954 | $870 |
| $10,000 to $14,999 | $2,097 | $1,892 | $1,441 | $860 | $515 |
| $15,000 to $24,999 | $3,349 | $2,735 | $2,164 | $1,449 | $465 |
| $25,000 to $49,999 | $3,635 | $3,595 | $2,850 | $1,780 | $266 |
| $50,000 to $74,999 | $1,557 | $1,556 | $1,055 | $581 | $32 |
| $75,000 or more | $1,407 | $1,398 | $868 | $513 | $22 |
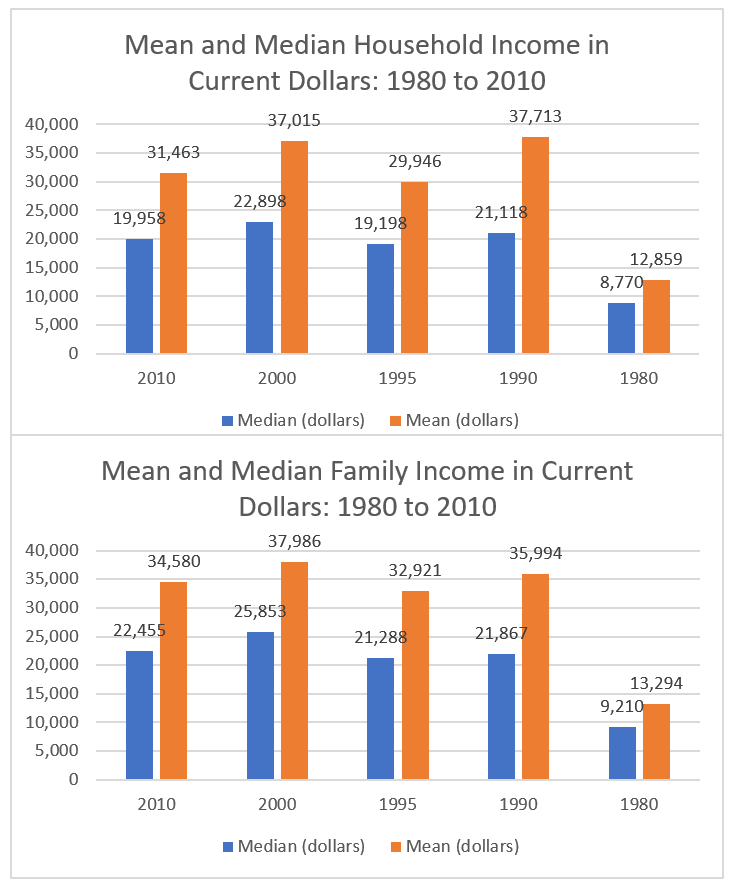
| Median (dollars) | $19,958 | $22,898 | $19,198 | $21,118 | $8,770 |
| Mean (dollars) | $31,463 | $37,015 | $29,946 | $37,713 | $12,859 |
SY 2017 Table 5.1 Family Income in Year before Census, CNMI: 1980 to 2000
Statistical Yearbook 2017 CNMI CSD
Note: All values in current dollars
| Income Level | 2010 | 2000 | 1995 | 1990 | 1980 |
|---|---|---|---|---|---|
| Source: U.S. Census Bureau and 1995 CNMI Census | |||||
| Less than $2,500 | $594 | $428 | $871 | $201 | $188 |
| $2,500 to $4,999 | $310 | $190 | $276 | $235 | $467 |
| $5,000 to $9,999 | $1,350 | $935 | $1,020 | $738 | $797 |
| $10,000 to $14,999 | $1,280 | $1,162 | $995 | $695 | $479 |
| $15,000 to $24,999 | $2,232 | $1,864 | $1,533 | $1,146 | $422 |
| $25,000 to $49,999 | $2,598 | $2,581 | $2,028 | $1,409 | $250 |
| $50,000 to $74,999 | $1,227 | $1,191 | $834 | $482 | $30 |
| $75,000 or more | $1,123 | $1,056 | $695 | $406 | $19 |
| Median (dollars) | $22,455 | $25,853 | $21,288 | $21,867 | $9,210 |
| Mean (dollars) | $34,580 | $37,986 | $32,921 | $35,994 | $13,294 |
To download HD image, right click on image and select “Save Image As”…


