DescriptionTable DataChart and Figure Data
Ch.5 INCOME
Ch.5 INCOME
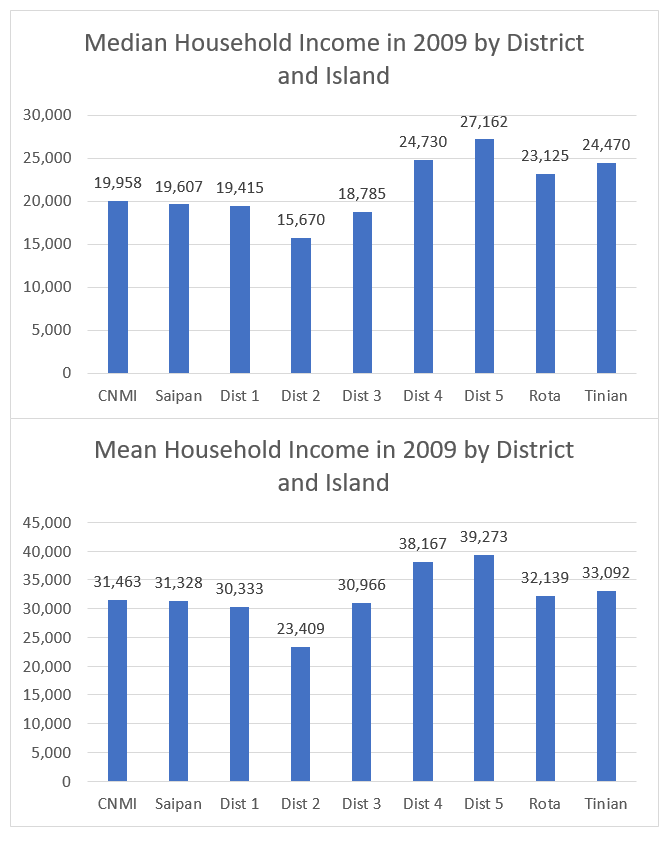
SY 2017 Table 5.2 Household Income in 2009 by District and Island, CNMI: 2010
Statistical Yearbook 2017 CNMI CSD
Universe: Households
| Household Income | Saipan District 1 |
Saipan District 2 |
Saipan District 3 |
Saipan District 4 |
Saipan District 5 |
Rota District 7 |
Tinian District 6 |
|---|---|---|---|---|---|---|---|
| Source: U.S. Census Bureau | |||||||
| Less than $2,500 | 322 | 145 | 235 | 45 | 105 | 26 | 25 |
| $2,500 to $4,999 | 164 | 90 | 185 | 30 | 42 | 23 | 24 |
| $5,000 to $9,999 | 654 | 391 | 964 | 109 | 196 | 94 | 121 |
| $10,000 to $14,999 | 558 | 334 | 705 | 125 | 173 | 112 | 90 |
| $15,000 to $24,999 | 861 | 454 | 1,130 | 228 | 350 | 142 | 184 |
| $25,000 to $29,999 | 268 | 121 | 285 | 67 | 134 | 54 | 53 |
| $30,000 to $39,999 | 381 | 188 | 459 | 105 | 207 | 102 | 112 |
| $40,000 to $49,999 | 289 | 79 | 337 | 91 | 161 | 54 | 88 |
| $50,000 to $74,999 | 423 | 116 | 449 | 122 | 263 | 84 | 100 |
| $75,000 to $99,999 | 172 | 42 | 195 | 65 | 114 | 39 | 46 |
| $100,000 or more | 195 | 50 | 239 | 79 | 115 | 25 | 31 |
| Median | $19,415 | $15,670 | $18,785 | $24,730 | $27,162 | $23,125 | $24,470 |
| Mean | $30,333 | $23,409 | $30,966 | $38,167 | $39,273 | $32,139 | $33,092 |
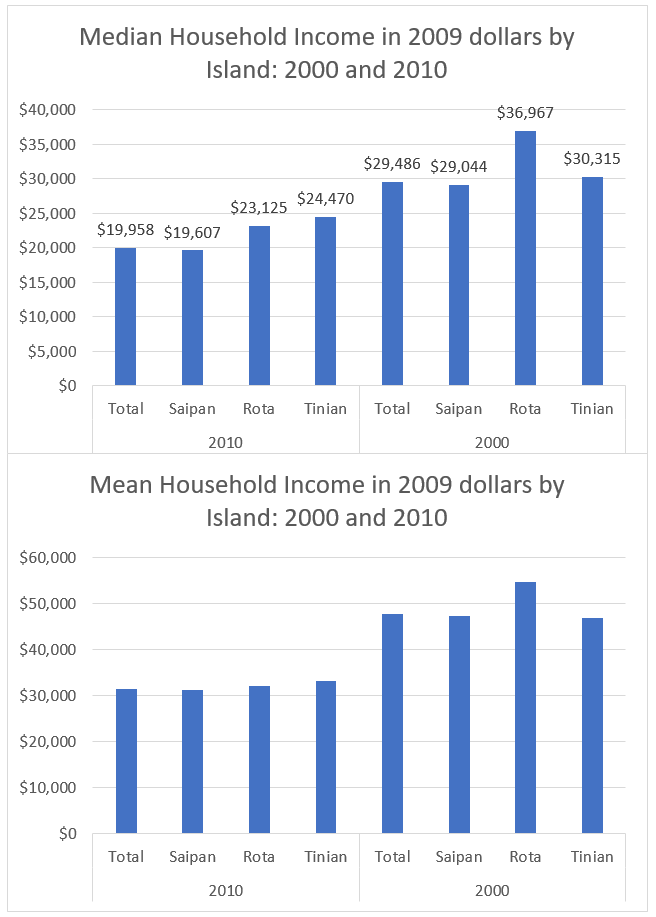
SY 2017 Table 5.3 Household Income in 2009 by Island, CNMI: 2010
Statistical Yearbook 2017 CNMI CSD
Universe: Households
| Household income 2010 | Saipan | Rota | Tinian |
|---|---|---|---|
| Source: U.S. Census Bureau | |||
| Less than $2,500 | 852 | 26 | 25 |
| $2,500 to $4,999 | 511 | 23 | 24 |
| $5,000 to $9,999 | 2,314 | 94 | 121 |
| $10,000 to $14,999 | 1,895 | 112 | 90 |
| $15,000 to $24,999 | 3,023 | 142 | 184 |
| $25,000 to $49,999 | 3,172 | 210 | 253 |
| $50,000 to $74,999 | 1,373 | 84 | 100 |
| $75,000 or more | 1,266 | 64 | 77 |
| Median (2009 dollars) | $19,607 | $23,125 | $24,470 |
| Mean (2009 dollars) | $31,328 | $32,139 | $33,092 |
SY 2017 Table 5.3 Household Income in 1999 by Island, CNMI: 2000
Statistical Yearbook 2017 CNMI CSD
Universe: Households
| Household income 2000 | Saipan | Rota | Tinian |
|---|---|---|---|
| Source: U.S. Census Bureau | |||
| Less than $2,500 | 535 | 20 | 56 |
| $2,500 to $4,999 | 263 | 22 | 22 |
| $5,000 to $9,999 | 1,773 | 71 | 117 |
| $10,000 to $14,999 | 1,718 | 84 | 90 |
| $15,000 to $24,999 | 2,475 | 136 | 124 |
| $25,000 to $49,999 | 3,180 | 232 | 182 |
| $50,000 to $74,999 | 1,334 | 114 | 108 |
| $75,000 or more | 1,229 | 78 | 91 |
| Median (1999 dollars) | $22,555 | $28,708 | $23,542 |
| Mean (1999 dollars) | $36,718 | $42,524 | $36,454 |
To download HD image, right click on image and select “Save Image As”…


