DescriptionTable DataChart and Figure Data
Ch.5 INCOME
Ch.5 INCOME
SY 2017 Table 5.4 Household Income in 2009 by type and District and Island, CNMI: 2010
Statistical Yearbook 2017 CNMI CSD
Universe: Households
| Household Income | Saipan District 1 |
Saipan District 2 |
Saipan District 3 |
Saipan District 4 |
Saipan District 5 |
Rota District 7 |
Tinian District 6 |
|---|---|---|---|---|---|---|---|
| Source: U.S. Census Bureau | |||||||
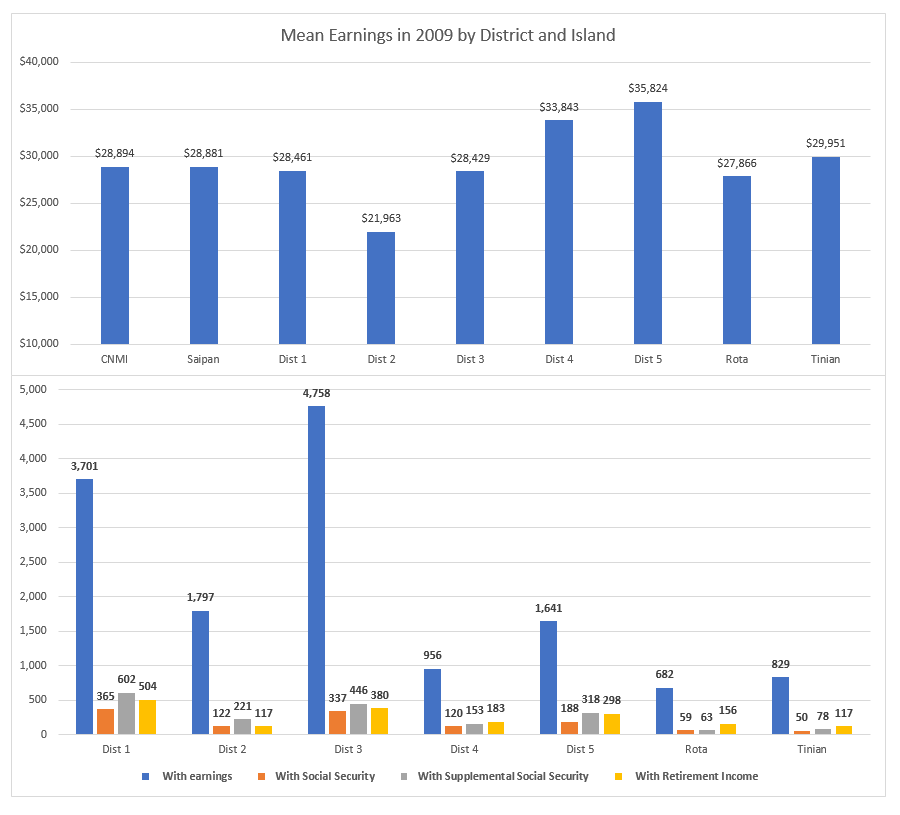
| With earnings | 3,701 | 1,797 | 4,758 | 956 | 1,641 | 682 | 829 |
| Mean earnings | $28,461 | $21,963 | $28,429 | $33,843 | $35,824 | $27,866 | $29,951 |
| With Social Security | 365 | 122 | 337 | 120 | 188 | 59 | 50 |
| Mean Social Secuirty | $8,349 | $8,510 | $8,530 | $9,208 | $8,218 | $8,158 | $7,275 |
| With Supplemental Social Security | 602 | 221 | 446 | 153 | 318 | 63 | 78 |
| Mean Supplemental Social Security | $4,220 | $4,161 | $3,922 | $5,023 | $5,036 | $4,085 | $3,809 |
| With Retirement Income | 504 | 117 | 380 | 183 | 298 | 156 | 117 |
| Mean Retirement Income | $21,589 | $21,977 | $25,165 | $23,905 | $23,843 | $24,991 | $22,882 |
SY 2017 Table 5.5 Household Income in 2009 by Type and Island, CNMI: 2010
Statistical Yearbook 2017 CNMI CSD
Universe: Households
| Household Income 2010 | Saipan | Rota | Tinian |
|---|---|---|---|
| Source: U.S. Census Bureau | |||
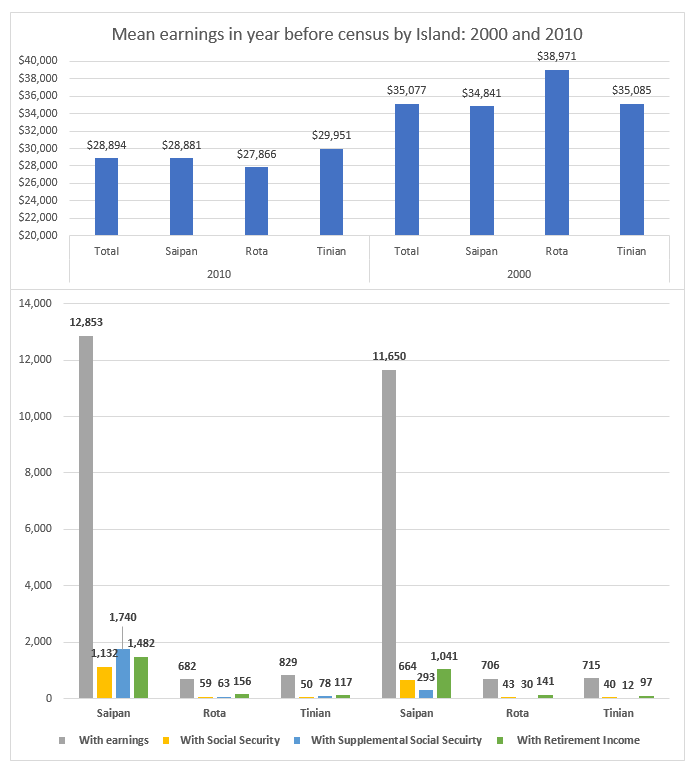
| With earnings | 12,853 | 682 | 829 |
| Mean earnings (dollars) | $28,881 | $27,866 | $29,951 |
| With Social Security | 1,132 | 59 | 50 |
| Mean Social Secuirty (dollars) | $8,489 | $8,158 | $7,275 |
| With Supplemental Social Secuirty | 1,740 | 63 | 78 |
| Mean Supplemental Social Security (dollars) | $4,356 | $4,085 | $3,809 |
| With Retirement Income | 1,482 | 156 | 117 |
| Mean Retirement Income (dollars) | $23,276 | $24,991 | $22,882 |
SY 2017 Table 5.5 Household Income in 1999 by Type and Island, CNMI: 2000
Statistical Yearbook 2017 CNMI CSD
Universe: Households
| Household Income 2000 | Saipan | Rota | Tinian |
|---|---|---|---|
| Source: U.S. Census Bureau | |||
| With earnings | 11,650 | 706 | 715 |
| Mean earnings (dollars) | $34,841 | $38,971 | $35,085 |
| With Social Security | 664 | 43 | 40 |
| Mean Social Secuirty (dollars) | $7,174 | $5,459 | $6,653 |
| With Supplemental Social Secuirty | 293 | 30 | 12 |
| Mean Supplemental Social Security (dollars) | $5,563 | $4,687 | $5,111 |
| With Retirement Income | 1,041 | 141 | 97 |
| Mean Retirement Income (dollars) | $19,322 | $19,332 | $19,253 |
To download HD image, right click on image and select “Save Image As”…


