DescriptionTable DataChart and Figure Data
Ch.5 INCOME
Ch.5 INCOME
SY 2017 Table 5.7 Family Income in 2009 by District and Island, CNMI: 2010
Statistical Yearbook 2017 CNMI CSD
Universe: Families
| Family Income | Saipan District 1 |
Saipan District 2 |
Saipan District 3 |
Saipan District 4 |
Saipan District 5 |
Rota District 7 |
Tinian District 6 |
|---|---|---|---|---|---|---|---|
| Source: U.S. Census Bureau | |||||||
| Less than $2,500 | 234 | 88 | 125 | 34 | 83 | 19 | 11 |
| $2,500 to $4,999 | 106 | 40 | 98 | 20 | 31 | 9 | 6 |
| $5,000 to $9,999 | 421 | 214 | 394 | 73 | 141 | 46 | 61 |
| $10,000 to $14,999 | 365 | 181 | 379 | 87 | 134 | 77 | 57 |
| $15,000 to $24,999 | 622 | 291 | 680 | 149 | 278 | 89 | 123 |
| $25,000 to $29,999 | 181 | 87 | 207 | 54 | 108 | 41 | 48 |
| $30,000 to $39,999 | 285 | 124 | 288 | 73 | 178 | 62 | 79 |
| $40,000 to $49,999 | 207 | 52 | 231 | 63 | 132 | 43 | 55 |
| $50,000 to $74,999 | 337 | 91 | 322 | 102 | 225 | 70 | 80 |
| $75,000 to $99,999 | 147 | 31 | 152 | 56 | 87 | 32 | 32 |
| $100,000 or more | 159 | 40 | 180 | 66 | 100 | 20 | 21 |
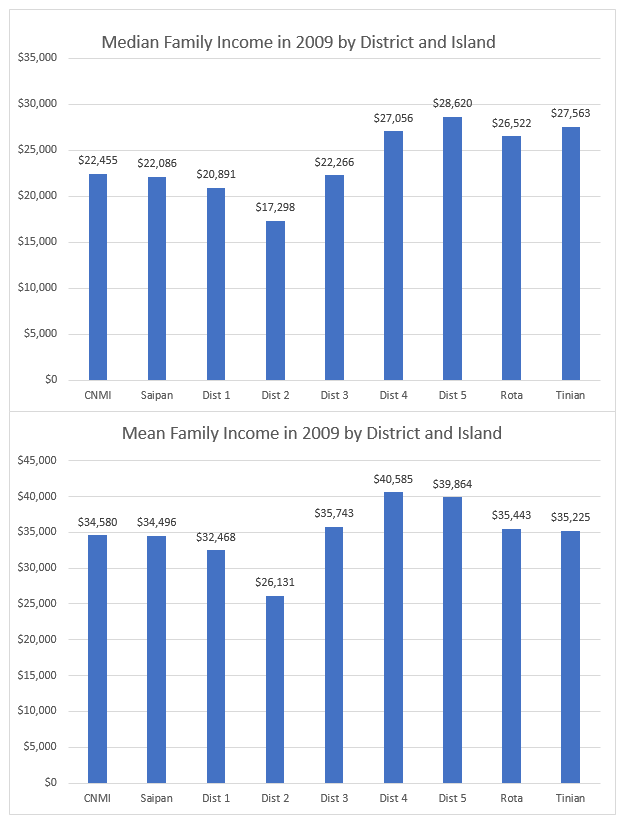
| Median | $20,891 | $17,298 | $22,266 | $27,056 | $28,620 | $26,522 | $27,563 |
| Mean | $32,468 | $26,131 | $35,743 | $40,585 | $39,864 | $35,443 | $35,225 |
SY 2017 Table 5.8 Family Income in 2009 by District and Island, CNMI: 2010
Statistical Yearbook 2017 CNMI CSD
Universe: Families
| Family Income 2010 | Saipan | Rota | Tinian |
|---|---|---|---|
| Source: U.S. Census Bureau | |||
| Less than $2,500 | 564 | 19 | 11 |
| $2,500 to $4,999 | 295 | 9 | 6 |
| $5,000 to $9,999 | 1,243 | 46 | 61 |
| $10,000 to $14,999 | 1,146 | 77 | 57 |
| $15,000 to $24,999 | 2,020 | 89 | 123 |
| $25,000 to $49,999 | 2,270 | 146 | 182 |
| $50,000 to $74,999 | 1,077 | 70 | 80 |
| $75,000 or more | 1,018 | 52 | 53 |
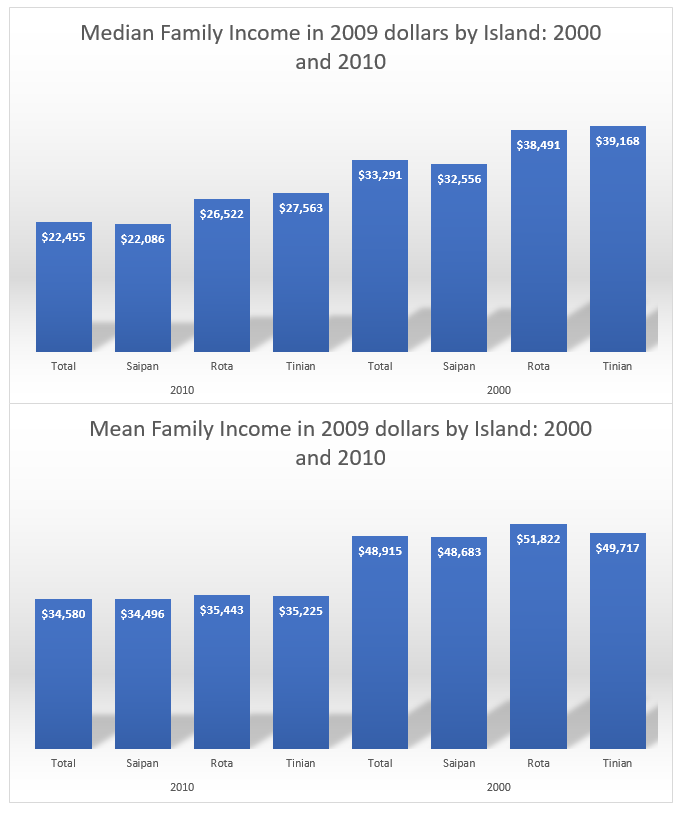
| Median (2009 dollars) | $22,086 | $26,522 | $27,563 |
| Mean (2009 dollars) | $34,496 | $35,443 | $35,225 |
SY 2017 Table 5.8 Family Income in 1999 by District and Island, CNMI: 2000
Statistical Yearbook 2017 CNMI CSD
Universe: Families
| Family income | Saipan | Rota | Tinian |
|---|---|---|---|
| Source: U.S. Census Bureau | |||
| Less than $2,500 | 366 | 18 | 44 |
| $2,500 to $4,999 | 164 | 16 | 10 |
| $5,000 to $9,999 | 864 | 39 | 32 |
| $10,000 to $14,999 | 1,072 | 43 | 46 |
| $15,000 to $24,999 | 1,680 | 99 | 85 |
| $25,000 to $49,999 | 2,268 | 181 | 132 |
| $50,000 to $74,999 | 1,006 | 88 | 97 |
| $75,000 or more | 944 | 54 | 58 |
| Median (1999 dollars) | $25,282 | $29,891 | $30,417 |
| Mean (1999 dollars) | $37,806 | $40,244 | $38,609 |
To download HD image, right click on image and select “Save Image As”…


