DescriptionTable DataChart and Figure Data
Ch.6 PUBLIC SAFETY
Ch.6 PUBLIC SAFETY
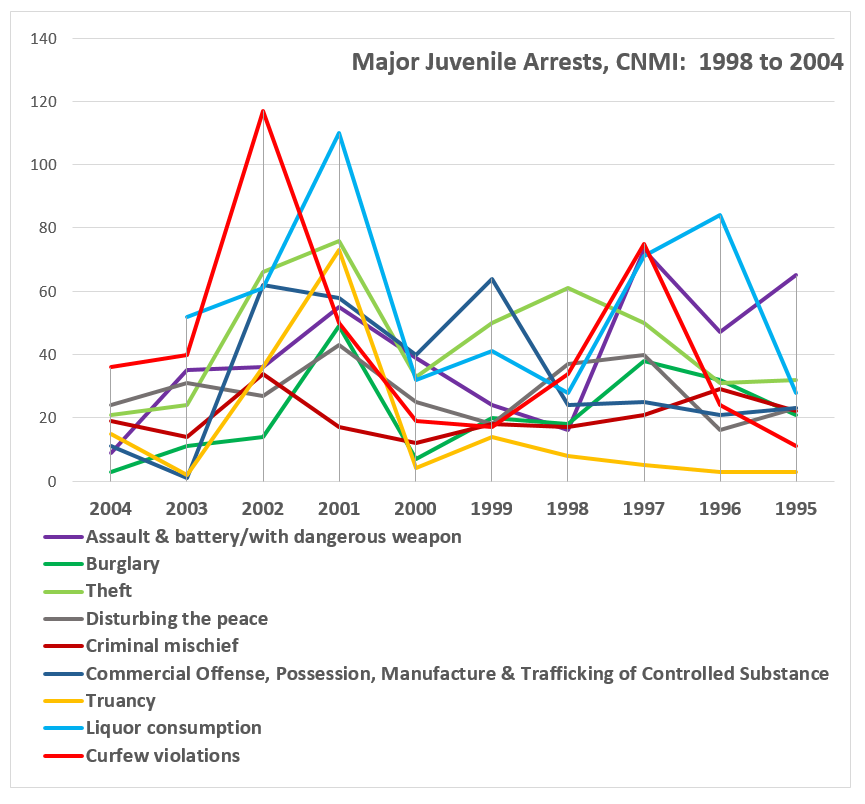
SY 2017 Table 6.1 Type and Number of Juvenile Arrests, CNMI: 1998 to 2004
Statistical Yearbook 2017 CNMI CSD
Note: “…” means data not available
| Type of Arrest | 2004 | 2003 | 2002 | 2001 | 2000 | 1999 | 1998 | 1997 | 1996 | 1995 |
|---|---|---|---|---|---|---|---|---|---|---|
| Source: Department of Yourth Services (DCCA) | ||||||||||
| Homicide | 2 | 0 | 0 | 0 | 0 | 3 | 0 | 2 | 0 | |
| Robbery | 5 | 1 | 8 | 4 | 2 | 11 | 2 | 5 | 5 | 4 |
| Assault & battery/with dangerous weapon | 9 | 35 | 36 | 55 | 39 | 24 | 16 | 73 | 47 | 65 |
| Burglary | 3 | 11 | 14 | 49 | 7 | 20 | 18 | 38 | 32 | 21 |
| Theft | 21 | 24 | 66 | 76 | 33 | 50 | 61 | 50 | 31 | 32 |
| Auto theft | 6 | 5 | 11 | 6 | 1 | 3 | 7 | 23 | 21 | 4 |
| Arson | 0 | … | 0 | 4 | 1 | 4 | 1 | 0 | 0 | 0 |
| Disturbing the peace | 24 | 31 | 27 | 43 | 25 | 18 | 37 | 40 | 16 | 23 |
| Criminal mischief | 19 | 14 | 34 | 17 | 12 | 18 | 17 | 21 | 29 | 22 |
| Commercial Offense, Possession, Manufacture & Trafficking of Controlled Substance |
11 | 1 | 62 | 58 | 40 | 64 | 24 | 25 | 21 | 23 |
| Possession of firearms | 0 | … | 0 | 1 | 0 | 2 | 0 | 0 | 1 | 0 |
| Criminal trespass | 0 | 2 | 13 | 0 | 4 | 2 | 8 | 3 | 0 | 9 |
| Other | 88 | 115 | 17 | 13 | 27 | 70 | 28 | 26 | ||
| Traffic | 3 | 8 | 5 | 14 | 9 | 5 | 4 | 7 | 7 | |
| Truancy | 15 | 2 | 36 | 73 | 4 | 14 | 8 | 5 | 3 | 3 |
| Liquor consumption | 52 | 61 | 110 | 32 | 41 | 28 | 71 | 84 | 28 | |
| Curfew violations | 36 | 40 | 117 | 50 | 19 | 17 | 34 | 75 | 24 | 11 |
| Tobacco | 9 | 10 | 7 | 8 | 2 | 1 | 14 | 6 | 1 | |
| Runaway | 0 | … | 4 | 9 | 0 | 0 | 1 | 0 | 6 | 0 |
To download HD image, right click on image and select “Save Image As”…