DescriptionTable DataChart and Figure Data
Ch.6 PUBLIC SAFETY
Ch.6 PUBLIC SAFETY
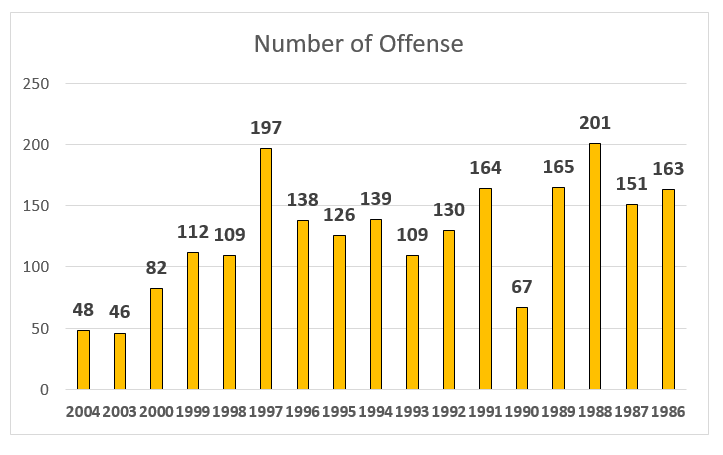
SY 2017 Table 6.2 Number of Violent and Property Crimes of Juvenile Offenses, CNMI: 1986 to 2004
Statistical Yearbook 2017 CNMI CSD
Note: No compiled figures for 2001 and 2002
Note: “…” means data not available
| Homicide | Rape | Robbery | Assault & Battery | Burglary | Larceny | Auto Theft | Arson | |
|---|---|---|---|---|---|---|---|---|
| Source: Department of Public Safety, Criminal Justice Information System | ||||||||
| 2004 | 0 | 0 | 5 | 34 | 3 | 0 | 6 | 0 |
| 2003 | … | … | 1 | 29 | 11 | … | 5 | … |
| 2000 | 0 | 0 | 2 | 38 | 7 | 33 | 1 | 1 |
| 1999 | 0 | 0 | 11 | 24 | 20 | 50 | 3 | 4 |
| 1998 | 3 | 1 | 2 | 16 | 18 | 61 | 7 | 1 |
| 1997 | 0 | 0 | 5 | 71 | 38 | 60 | 23 | 0 |
| 1996 | 2 | 0 | 5 | 47 | 32 | 31 | 21 | 0 |
| 1995 | 0 | 0 | 4 | 65 | 21 | 32 | 4 | 0 |
| 1994 | 0 | 0 | 6 | 69 | 23 | 34 | 6 | 1 |
| 1993 | 0 | 0 | 3 | 45 | 29 | 24 | 8 | 0 |
| 1992 | 2 | 0 | 1 | 49 | 39 | 28 | 11 | 0 |
| 1991 | 0 | 0 | 14 | 49 | 55 | 31 | 15 | 0 |
| 1990 | 0 | 0 | 0 | 34 | 11 | 19 | 3 | 0 |
| 1989 | 0 | 1 | 2 | 46 | 52 | 44 | 18 | 2 |
| 1988 | 0 | 1 | 1 | 16 | 132 | 39 | 11 | 1 |
| 1987 | 1 | 0 | 0 | 29 | 75 | 35 | 11 | 0 |
| 1986 | 1 | 0 | 0 | 43 | 44 | 48 | 26 | 1 |
To download HD image, right click on image and select “Save Image As”…