DescriptionTable DataChart and Figure Data
Ch.7 ELECTION
Ch.7 ELECTION
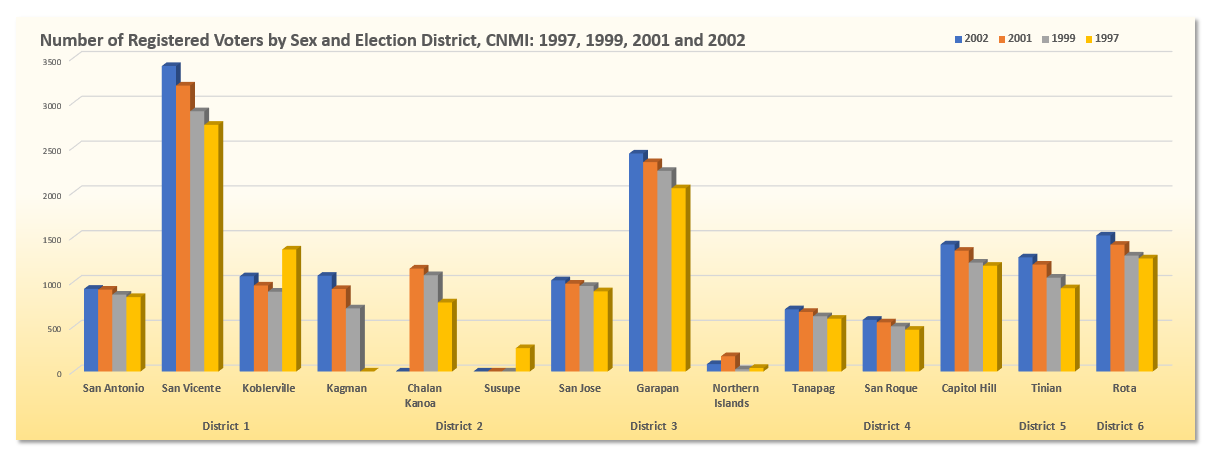
SY 2017 Table 7.1 Number of Registered Voters by Sex and Election District, CNMI: 1997, 1999, 2001 and 2002
Statistical Yearbook 2017 CNMI CSD
Note: Districts are rearranged in 2007
Note: “…” means data not available
| District | Village | 2002 | 2001 | 1999 | 1997 | |
|---|---|---|---|---|---|---|
| Source: Election Commission | ||||||
| All Voters | District 1 | San Antonio | 923 | 914 | 858 | 831 |
| All Voters | District 1 | San Vicente | 3,409 | 3,191 | 2,904 | 2,753 |
| All Voters | District 1 | Koblerville | 1,063 | 960 | 891 | 1,362 |
| All Voters | District 1 | Kagman | 1,069 | 921 | 705 | … |
| All Voters | District 2 | Chalan Kanoa | … | 1,149 | 1,075 | 771 |
| All Voters | District 2 | Susupe | … | … | … | 261 |
| All Voters | District 3 | San Jose | 1,018 | 980 | 955 | 895 |
| All Voters | District 3 | Garapan | 2,433 | 2,337 | 2,239 | 2,045 |
| All Voters | District 3 | Northern Islands | 83 | 171 | 25 | 40 |
| All Voters | District 4 | Tanapag | 694 | 665 | 617 | 589 |
| All Voters | District 4 | San Roque | 577 | 548 | 504 | 466 |
| All Voters | District 4 | Capitol Hill | 1,418 | 1,348 | 1,215 | 1,180 |
| All Voters | District 5 | Tinian | 1,274 | 1,193 | 1,047 | 929 |
| All Voters | District 6 | Rota | 1,518 | 1,415 | 1,294 | 1,262 |
| Male | District 1 | San Antonio | 481 | … | 460 | 434 |
| Male | District 1 | San Vicente | 1,718 | … | 1,479 | 1,400 |
| Male | District 1 | Koblerville | 522 | … | 444 | 703 |
| Male | District 1 | Kagman | 556 | … | 371 | – |
| Male | District 2 | Chalan Kanoa | … | … | 575 | 403 |
| Male | District 2 | Susupe | … | … | … | 149 |
| Male | District 3 | San Jose | 497 | … | 494 | 441 |
| Male | District 3 | Garapan | 1,267 | … | 1,138 | 1,035 |
| Male | District 3 | Northern Islands | 62 | … | 13 | 22 |
| Male | District 4 | Tanapag | 340 | … | 321 | 318 |
| Male | District 4 | San Roque | 296 | … | 257 | 245 |
| Male | District 4 | Capitol Hill | 733 | … | 621 | 603 |
| Male | District 5 | Tinian | 658 | … | 556 | 489 |
| Male | District 6 | Rota | 792 | … | 683 | 676 |
| Female | District 1 | San Antonio | 442 | … | 398 | 397 |
| Female | District 1 | San Vicente | 1,691 | … | 1,425 | 1,353 |
| Female | District 1 | Koblerville | 541 | … | 447 | 659 |
| Female | District 1 | Kagman | 513 | … | 334 | – |
| Female | District 2 | Chalan Kanoa | … | … | 500 | 368 |
| Female | District 2 | Susupe | … | … | … | 112 |
| Female | District 3 | San Jose | 521 | … | 461 | 454 |
| Female | District 3 | Garapan | 1,166 | … | 1,101 | 1,010 |
| Female | District 3 | Northern Islands | 21 | … | 12 | 18 |
| Female | District 4 | Tanapag | 354 | … | 296 | 271 |
| Female | District 4 | San Roque | 281 | … | 247 | 221 |
| Female | District 4 | Capitol Hill | 685 | … | 594 | 577 |
| Female | District 5 | Tinian | 616 | … | 491 | 440 |
| Female | District 6 | Rota | 726 | … | 611 | 586 |
Ch.7 ELECTION
To download, right click on the chart and select “Save Image As”…