DescriptionTable DataChart and Figure Data
Ch.7 ELECTION
Ch.7 ELECTION
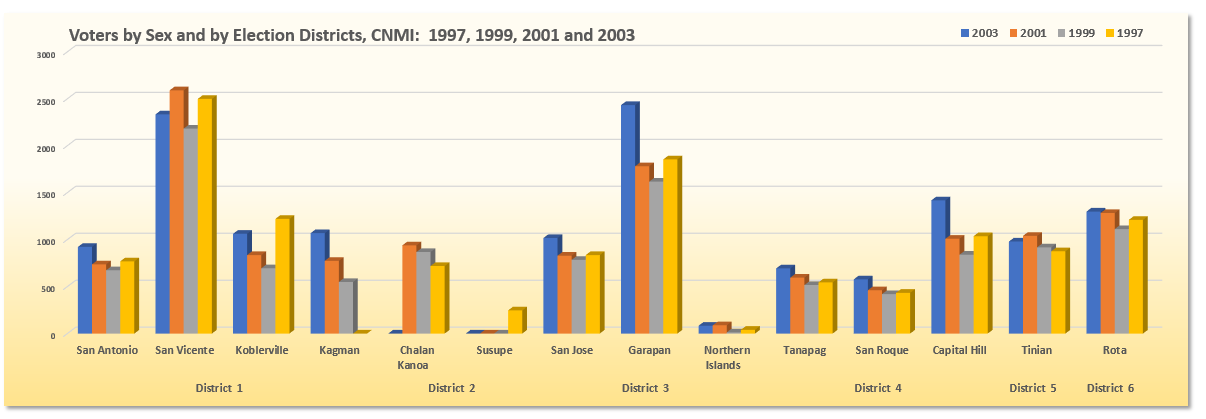
SY 2017 Table 7.2 Voters by Sex and by Election Districts, CNMI: 1997, 1999, 2001 and 2003
Statistical Yearbook 2017 CNMI CSD
Note: Polling places indicate villages. Since 1999 some villages are combined to reflect only election district
Note: Total figures for 2002 were submitted by election district only, not by villages and not by gender in this category
Note: “…” means data not available
Note: Districts are rearranged in 2007
| District | Village | 2003 | 2001 | 1999 | 1997 | |
|---|---|---|---|---|---|---|
| Source: Election Commission | ||||||
| All Voters | District 1 | San Antonio | 923 | 737 | 674 | 769 |
| All Voters | District 1 | San Vicente | 2,334 | 2,590 | 2,182 | 2,499 |
| All Voters | District 1 | Koblerville | 1,063 | 836 | 695 | 1,221 |
| All Voters | District 1 | Kagman | 1,069 | 774 | 549 | – |
| All Voters | District 2 | Chalan Kanoa | … | 939 | 868 | 719 |
| All Voters | District 2 | Susupe | … | … | … | 247 |
| All Voters | District 3 | San Jose | 1,018 | 829 | 785 | 836 |
| All Voters | District 3 | Garapan | 2,433 | 1,782 | 1,618 | 1,855 |
| All Voters | District 3 | Northern Islands | 83 | 88 | 13 | 40 |
| All Voters | District 4 | Tanapag | 694 | 596 | 517 | 545 |
| All Voters | District 4 | San Roque | 577 | 461 | 420 | 434 |
| All Voters | District 4 | Capital Hill | 1,418 | 1,010 | 840 | 1,037 |
| All Voters | District 5 | Tinian | 980 | 1,040 | 918 | 876 |
| All Voters | District 6 | Rota | 1,299 | 1,284 | 1,112 | 1,211 |
| Male | District 1 | San Antonio | 481 | 384 | 363 | 401 |
| Male | District 1 | San Vicente | 1,148 | 1,272 | 1,102 | 1,263 |
| Male | District 1 | Koblerville | 522 | 402 | 345 | 628 |
| Male | District 1 | Kagman | 513 | 406 | 286 | – |
| Male | District 2 | Chalan Kanoa | … | 488 | 461 | 375 |
| Male | District 2 | Susupe | … | … | … | 137 |
| Male | District 3 | San Jose | 497 | 392 | 402 | 412 |
| Male | District 3 | Garapan | 1,267 | 881 | 795 | 919 |
| Male | District 3 | Northern Islands | 62 | 66 | 5 | 22 |
| Male | District 4 | Tanapag | 340 | 302 | 263 | 294 |
| Male | District 4 | San Roque | 296 | 239 | 217 | 228 |
| Male | District 4 | Capital Hill | 733 | 520 | 427 | 525 |
| Male | District 5 | Tinian | 658 | 534 | 479 | 460 |
| Male | District 6 | Rota | 792 | 670 | 583 | 648 |
| Female | District 1 | San Antonio | 442 | 353 | 311 | 368 |
| Female | District 1 | San Vicente | 1,186 | 1,318 | 1,080 | 1,236 |
| Female | District 1 | Koblerville | 541 | 434 | 350 | 593 |
| Female | District 1 | Kagman | 556 | 368 | 263 | – |
| Female | District 2 | Chalan Kanoa | … | 451 | 407 | 344 |
| Female | District 2 | Susupe | … | … | … | 110 |
| Female | District 3 | San Jose | 521 | 437 | 383 | 424 |
| Female | District 3 | Garapan | 1,166 | 901 | 823 | 936 |
| Female | District 3 | Northern Islands | 21 | 22 | 8 | 18 |
| Female | District 4 | Tanapag | 354 | 294 | 254 | 251 |
| Female | District 4 | San Roque | 281 | 222 | 203 | 206 |
| Female | District 4 | Capital Hill | 685 | 490 | 413 | 512 |
| Female | District 5 | Tinian | 616 | 506 | 439 | 416 |
| Female | District 6 | Rota | 726 | 614 | 529 | 563 |
Ch.7 ELECTION
To download, right click on the chart and select “Save Image As”…