DescriptionTable DataChart and Figure Data
Ch.7 ELECTION
Ch.7 ELECTION
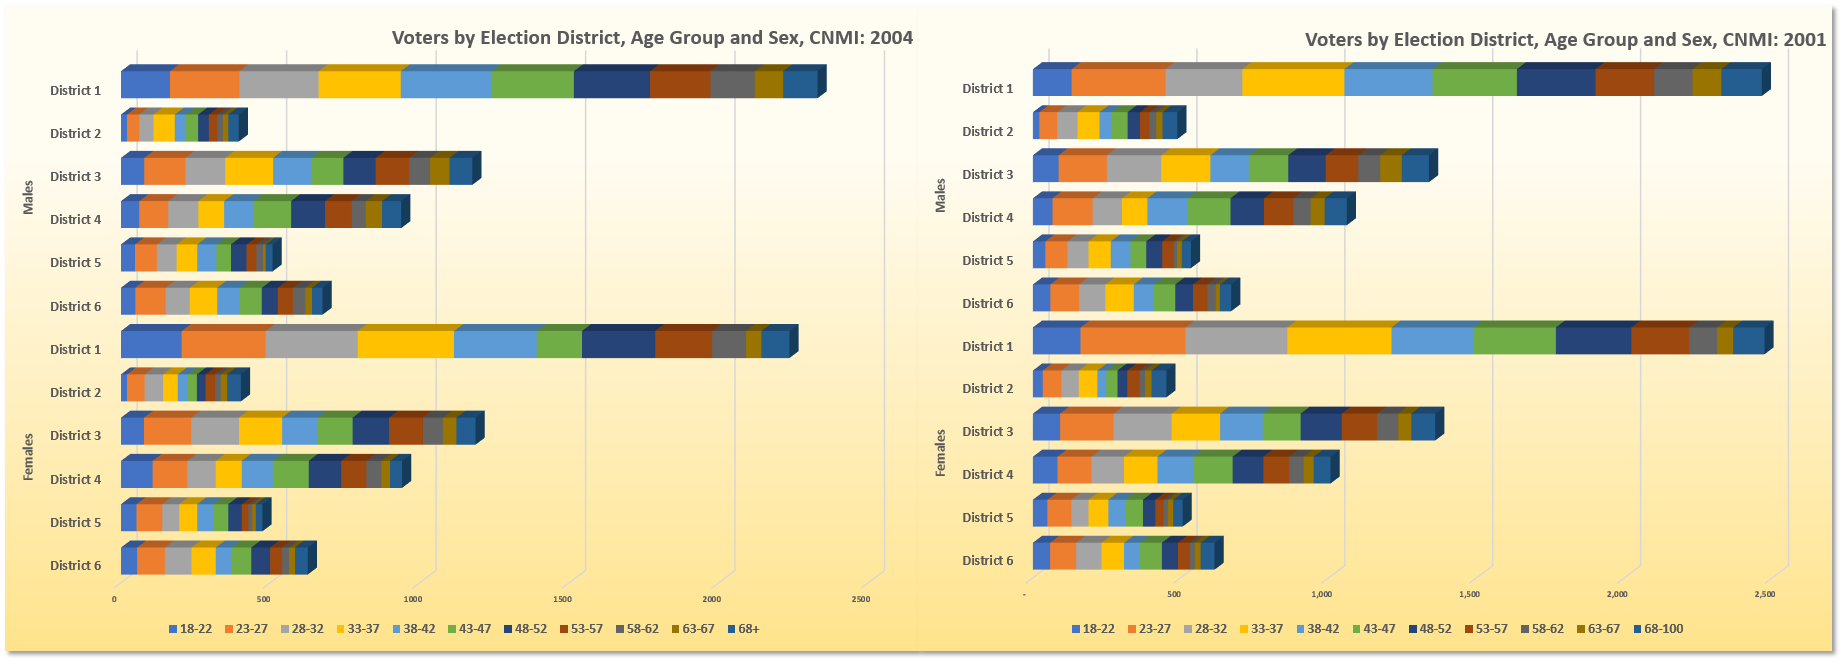
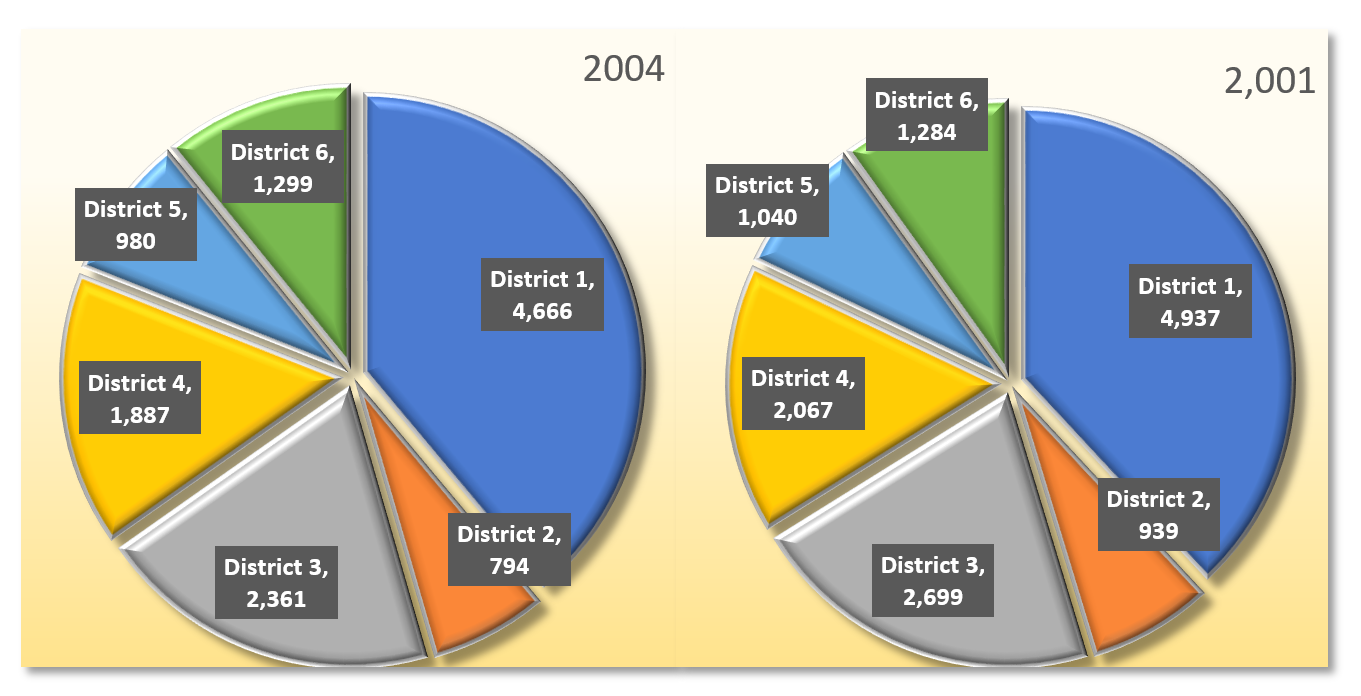
SY 2017 Table 7.4 Voters by Election District, Age Group and Sex, CNMI: 2004
Statistical Yearbook 2017 CNMI CSD
Note: Districts are rearranged in 2007
| District | 18-22 | 23-27 | 28-32 | 33-37 | 38-42 | 43-47 | 48-52 | 53-57 | 58-62 | 63-67 | 68+ | |
|---|---|---|---|---|---|---|---|---|---|---|---|---|
| Source: Election Commission | ||||||||||||
| All Voters | District 1 | 367 | 513 | 573 | 597 | 581 | 526 | 500 | 393 | 261 | 146 | 209 |
| All Voters | District 2 | 40 | 100 | 110 | 120 | 70 | 72 | 65 | 60 | 39 | 34 | 80 |
| All Voters | District 3 | 155 | 296 | 293 | 304 | 245 | 226 | 230 | 225 | 137 | 110 | 140 |
| All Voters | District 4 | 167 | 213 | 196 | 173 | 201 | 247 | 223 | 173 | 97 | 83 | 114 |
| All Voters | District 5 | 99 | 159 | 123 | 129 | 119 | 98 | 97 | 55 | 35 | 21 | 45 |
| All Voters | District 6 | 102 | 195 | 169 | 173 | 130 | 138 | 117 | 90 | 65 | 42 | 78 |
| Male | District 1 | 164 | 232 | 265 | 275 | 304 | 275 | 255 | 202 | 148 | 95 | 115 |
| Male | District 2 | 20 | 41 | 48 | 71 | 37 | 41 | 36 | 28 | 19 | 18 | 35 |
| Male | District 3 | 78 | 138 | 133 | 160 | 127 | 108 | 108 | 112 | 70 | 65 | 76 |
| Male | District 4 | 61 | 97 | 101 | 86 | 97 | 127 | 114 | 89 | 47 | 54 | 64 |
| Male | District 5 | 47 | 73 | 66 | 69 | 64 | 49 | 52 | 33 | 22 | 9 | 23 |
| Male | District 6 | 48 | 102 | 80 | 92 | 76 | 73 | 54 | 50 | 42 | 22 | 35 |
| Female | District 1 | 203 | 281 | 308 | 322 | 277 | 151 | 245 | 191 | 113 | 51 | 94 |
| Female | District 2 | 20 | 59 | 62 | 49 | 33 | 31 | 29 | 32 | 19 | 21 | 46 |
| Female | District 3 | 77 | 158 | 160 | 144 | 118 | 118 | 122 | 113 | 67 | 45 | 64 |
| Female | District 4 | 106 | 116 | 95 | 87 | 104 | 120 | 109 | 84 | 50 | 29 | 40 |
| Female | District 5 | 52 | 86 | 57 | 60 | 55 | 49 | 45 | 22 | 13 | 12 | 22 |
| Female | District 6 | 54 | 93 | 89 | 81 | 54 | 65 | 63 | 40 | 23 | 20 | 43 |
SY 2017 Table 7.4 Voters by Election District, Age Group and Sex, CNMI: 2001
Statistical Yearbook 2017 CNMI CSD
Note: Districts are rearranged in 2007
| District | 18-22 | 23-27 | 28-32 | 33-37 | 38-42 | 43-47 | 48-52 | 53-57 | 58-62 | 63-67 | 68-100 | |
|---|---|---|---|---|---|---|---|---|---|---|---|---|
| Source: Election Commission | ||||||||||||
| All Voters | District 1 | 292 | 672 | 604 | 697 | 575 | 564 | 521 | 394 | 224 | 151 | 243 |
| All Voters | District 2 | 55 | 123 | 128 | 137 | 71 | 92 | 75 | 74 | 41 | 43 | 100 |
| All Voters | District 3 | 179 | 344 | 380 | 330 | 274 | 261 | 266 | 230 | 145 | 117 | 173 |
| All Voters | District 4 | 149 | 251 | 209 | 199 | 255 | 280 | 217 | 187 | 107 | 81 | 132 |
| All Voters | District 5 | 91 | 156 | 129 | 142 | 125 | 112 | 96 | 67 | 25 | 34 | 63 |
| All Voters | District 6 | 117 | 185 | 175 | 172 | 121 | 147 | 114 | 90 | 44 | 34 | 85 |
| Male | District 1 | 131 | 317 | 260 | 345 | 298 | 285 | 266 | 198 | 130 | 97 | 137 |
| Male | District 2 | 22 | 60 | 69 | 74 | 41 | 54 | 42 | 32 | 23 | 21 | 50 |
| Male | District 3 | 87 | 163 | 184 | 166 | 130 | 133 | 127 | 110 | 74 | 73 | 92 |
| Male | District 4 | 66 | 136 | 99 | 86 | 135 | 146 | 113 | 100 | 58 | 47 | 75 |
| Male | District 5 | 42 | 75 | 71 | 75 | 67 | 53 | 54 | 39 | 11 | 16 | 31 |
| Male | District 6 | 59 | 97 | 89 | 96 | 67 | 73 | 60 | 49 | 28 | 14 | 38 |
| Female | District 1 | 161 | 355 | 344 | 352 | 277 | 279 | 255 | 196 | 94 | 54 | 106 |
| Female | District 2 | 33 | 63 | 59 | 63 | 30 | 38 | 33 | 42 | 18 | 22 | 50 |
| Female | District 3 | 92 | 181 | 196 | 164 | 144 | 128 | 139 | 120 | 71 | 44 | 81 |
| Female | District 4 | 83 | 115 | 110 | 113 | 120 | 134 | 104 | 87 | 49 | 34 | 57 |
| Female | District 5 | 49 | 81 | 58 | 67 | 58 | 59 | 42 | 28 | 14 | 18 | 32 |
| Female | District 6 | 58 | 88 | 86 | 76 | 54 | 74 | 54 | 41 | 16 | 20 | 47 |
Ch.7 ELECTION
To download, right click on the chart and select “Save Image As”…