DescriptionTable DataChart and Figure Data
Ch.7 ELECTION
Ch.7 ELECTION
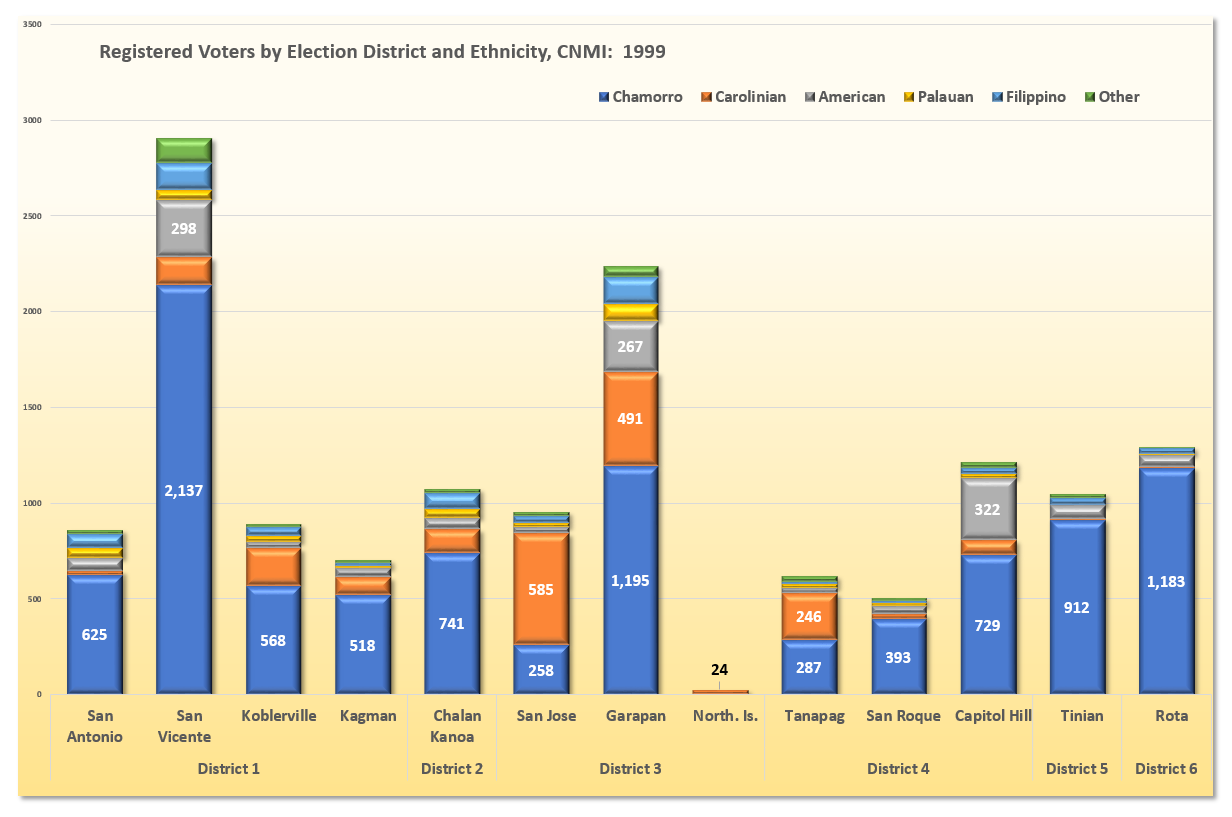
SY 2017 Table 7.5 Registered Voters by Election District and Ethnicity, CNMI: 1999
Statistical Yearbook 2017 CNMI CSD
Note: This is the most recent data available by election district and by ethnicity
Note: Districts are rearranged in 2007
| District | Village | Chamorro | Carolinian | American | Palauan | Filippino | Other |
|---|---|---|---|---|---|---|---|
| Source: Election Commission | |||||||
| District 1 | San Antonio | 625 | 19 | 67 | 52 | 74 | 21 |
| District 1 | San Vicente | 2,137 | 150 | 298 | 50 | 139 | 130 |
| District 1 | Koblerville | 568 | 198 | 33 | 31 | 47 | 14 |
| District 1 | Kagman | 518 | 96 | 47 | 12 | 16 | 16 |
| District 2 | Chalan Kanoa | 741 | 126 | 53 | 47 | 87 | 21 |
| District 3 | San Jose | 258 | 585 | 31 | 20 | 36 | 25 |
| District 3 | Garapan | 1,195 | 491 | 267 | 89 | 140 | 57 |
| District 3 | North. Is. | 1 | 24 | – | – | – | – |
| District 4 | Tanapag | 287 | 246 | 24 | 23 | 9 | 28 |
| District 4 | San Roque | 393 | 28 | 42 | 14 | 14 | 13 |
| District 4 | Capitol Hill | 729 | 79 | 322 | 23 | 30 | 32 |
| District 5 | Tinian | 912 | 6 | 70 | 4 | 36 | 18 |
| District 6 | Rota | 1,183 | 6 | 62 | 6 | 30 | 7 |
Ch.7 ELECTION
To download, right click on the chart and select “Save Image As”…