DescriptionTable DataChart and Figure Data
Ch.9 HOUSING
Ch.9 HOUSING
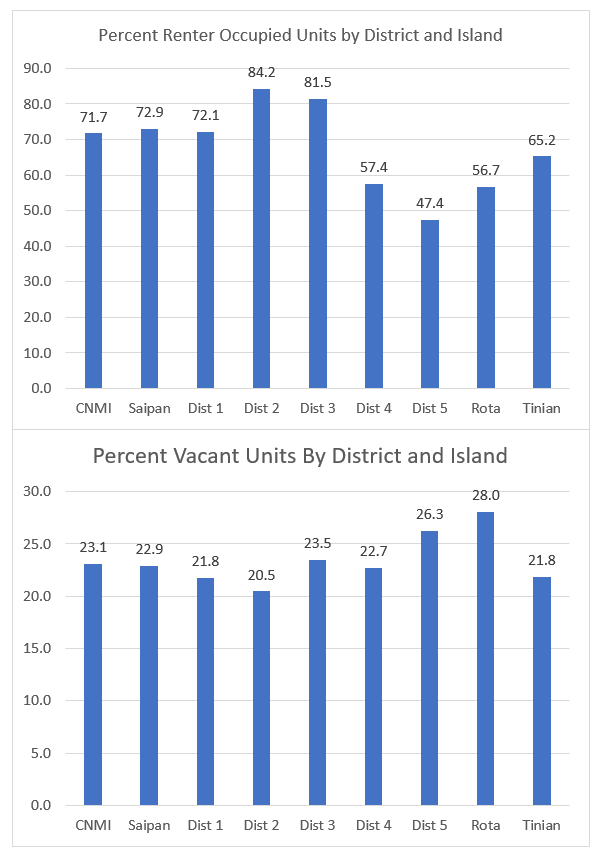
SY 2017 Table 9.1 Housing Occupany by District and Island, CNMI: 2010
Statistical Yearbook 2017 CNMI CSD
Universe: Total housing units
| Saipan District 1 |
Saipan District 2 |
Saipan District 3 |
Saipan District 4 |
Saipan District 5 |
Rota District 7 |
Tinian District 6 |
||
|---|---|---|---|---|---|---|---|---|
| Source: U.S. Census Bureau | ||||||||
| Occupied housing units | Owner-occupied | 1,196 | 317 | 960 | 454 | 979 | 327 | 304 |
| Occupied housing units | Renter-occupied | 3,091 | 1,693 | 4,223 | 612 | 881 | 428 | 570 |
| Vacant units | Vacant units | 1,192 | 517 | 1,592 | 313 | 663 | 294 | 244 |
| Vacant units | For seasonal, recreational, or occasional use | 49 | 25 | 184 | 31 | 43 | 46 | 9 |
| Population in occupied units | Owner-occupied | 5,110 | 1,288 | 3,786 | 1,903 | 4,189 | 1,258 | 1,310 |
| Population in occupied units | Renter-occupied | 9,856 | 4,844 | 11,317 | 1,853 | 2,920 | 1,186 | 1,492 |
| Percentage | Owner-occupied | 4.3% | 4.1% | 3.9% | 4.2% | 4.3% | 3.8% | 4.3% |
| Percentage | Renter-occupied | 3.2% | 2.9% | 2.7% | 3.0% | 3.3% | 2.8% | 2.6% |
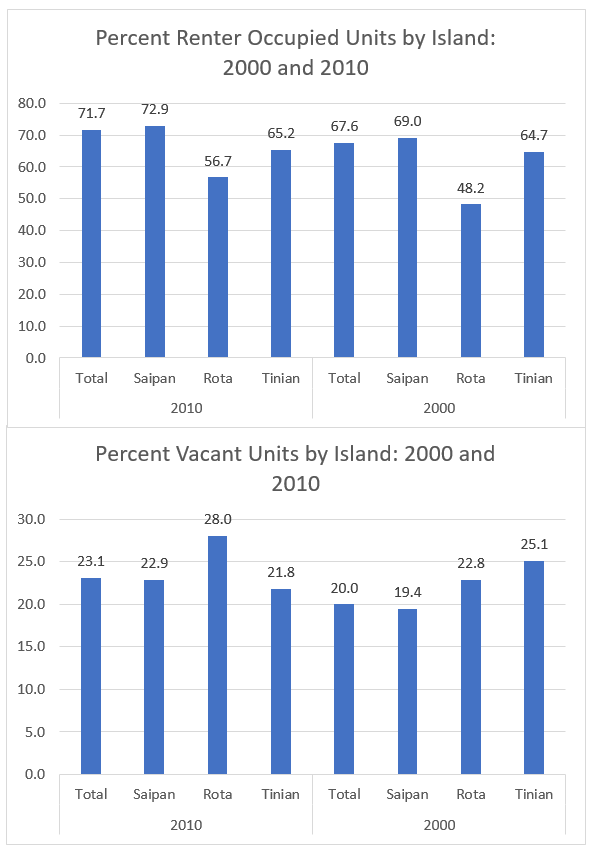
SY 2017 Table 9.2 Housing Occupany by District and Island, CNMI: 2010
Statistical Yearbook 2017 CNMI CSD
Universe: Total housing units
| 2010 | Saipan | Rota | Tinian | |
|---|---|---|---|---|
| Source: U.S. Census Bureau | ||||
| Occupied housing units | Owner-occupied | 3,906 | 327 | 304 |
| Occupied housing units | Renter-occupied | 10,500 | 428 | 570 |
| Vacant units | Vacant units | 4,277 | 294 | 244 |
| Vacant units | Percent | 22.9% | 28.0% | 21.8% |
| Population in occupied units | Owner-occupied | 16,276 | 1,258 | 1,310 |
| Population in occupied units | Renter-occupied | 30,790 | 1,186 | 1,492 |
| Percentage | Owner-occupied | 4.2% | 3.8% | 4.3% |
| Percentage | Renter-occupied | 2.9% | 2.8% | 2.6% |
SY 2017 Table 9.2 Housing Occupany by District and Island, CNMI: 2000
Statistical Yearbook 2017 CNMI CSD
Universe: Total housing units
| 2000 | Saipan | Rota | Tinian | |
|---|---|---|---|---|
| Source: U.S. Census Bureau | ||||
| Occupied housing units | Owner-occupied | 3,878 | 392 | 279 |
| Occupied housing units | Renter-occupied | 8,629 | 365 | 511 |
| Vacant units | Vacant units | 3,020 | 224 | 265 |
| Vacant units | Percent | 19.4% | 22.8% | 25.1% |
| Population in occupied units | Owner-occupied | 19,235 | 1,811 | 1,406 |
| Population in occupied units | Renter-occupied | 26,318 | 1,194 | 1,456 |
| Percentage | Owner-occupied | 5.0% | 4.6% | 5.0% |
| Percentage | Renter-occupied | 3.1% | 3.3% | 2.9% |
Ch.9 HOUSING
To download HD image, right click on image and select “Save Image As”…


