DescriptionTable DataChart and Figure Data
Ch.9 HOUSING
Ch.9 HOUSING
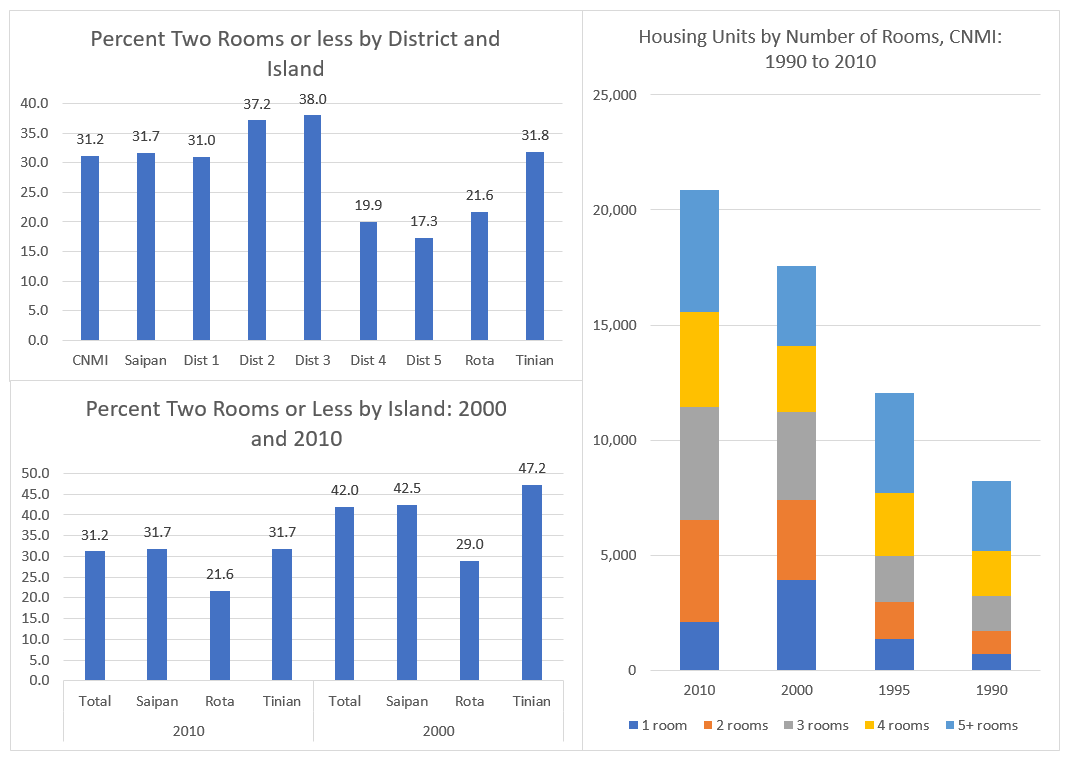
SY 2017 Table 9.16 Rooms by District and Island, CNMI: 2010
Statistical Yearbook 2017 CNMI CSD
Universe: Total housing units
| Saipan District 1 |
Saipan District 2 |
Saipan District 3 |
Saipan District 4 |
Saipan District 5 |
Tinian District 6 |
Rota District 7 |
|
|---|---|---|---|---|---|---|---|
| Source: U.S. Census Bureau | |||||||
| 1 room | 415 | 254 | 1,033 | 87 | 103 | 105 | 79 |
| 2 rooms | 1,285 | 685 | 1,541 | 188 | 333 | 251 | 148 |
| 3 rooms | 1,201 | 671 | 1,605 | 297 | 628 | 244 | 265 |
| 4 rooms | 1,117 | 430 | 1,207 | 318 | 647 | 222 | 214 |
| 5 rooms | 696 | 239 | 587 | 234 | 408 | 144 | 182 |
| 6 rooms | 338 | 117 | 327 | 116 | 180 | 75 | 83 |
| 7 rooms | 188 | 36 | 166 | 64 | 107 | 32 | 29 |
| 8 rooms | 81 | 26 | 62 | 36 | 55 | 29 | 23 |
| 9 or more rooms | 158 | 69 | 247 | 39 | 62 | 16 | 26 |
| Median | 3.4 | 3 | 3 | 3.9 | 3.8 | 3.3 | 3.7 |
SY 2017 Table 9.17 Rooms by Island, CNMI: 2010
Statistical Yearbook 2017 CNMI CSD
Universe: Total housing units
| 2010 | Saipan | Rota | Tinian |
|---|---|---|---|
| Source: U.S. Census Bureau | |||
| 1 room | 1,892 | 79 | 105 |
| 2 rooms | 4,032 | 148 | 251 |
| 3 rooms | 4,402 | 265 | 244 |
| 4 rooms | 3,719 | 214 | 222 |
| 5 rooms | 2,164 | 182 | 144 |
| 6 rooms | 1,078 | 83 | 75 |
| 7 rooms | 561 | 29 | 32 |
| 8 rooms | 260 | 23 | 29 |
| 9 or more rooms | 575 | 26 | 16 |
| Median | 3.3 | 3.7 | 3.3 |
SY 2017 Table 9.17 Rooms by Island, CNMI: 2000
Statistical Yearbook 2017 CNMI CSD
Universe: Total housing units
| 2000 | Saipan | Rota | Tinian |
|---|---|---|---|
| Source: U.S. Census Bureau | |||
| 1 room | 3,461 | 128 | 309 |
| 2 rooms | 3,131 | 156 | 189 |
| 3 rooms | 3,425 | 205 | 195 |
| 4 rooms | 2,518 | 196 | 161 |
| 5 rooms | 1,463 | 157 | 111 |
| 6 rooms | 796 | 74 | 48 |
| 7 rooms | 319 | 23 | 19 |
| 8 rooms | 199 | 19 | 15 |
| 9 or more rooms | 215 | 23 | 8 |
| Median | 2.7 | 3.5 | 2.7 |
SY 2017 Table 9.18 Rooms by District and Island, CNMI: 2010
Statistical Yearbook 2017 CNMI CSD
Universe: Total housing units
| 2010 | 2010 | 2000 | 2000 | 1995 | 1995 | 1990 | 1990 | |
|---|---|---|---|---|---|---|---|---|
| Source: U.S. Census Bureau | ||||||||
| 1 room | 2,076 | 10.0% | 3,898 | 22.2% | 1,351 | 11.2% | 677 | 8.2% |
| 2 rooms | 4,431 | 21.3% | 3,476 | 19.8% | 1,623 | 13.5% | 1,007 | 12.3% |
| 3 rooms | 4,911 | 23.6% | 3,825 | 21.8% | 1,991 | 16.5% | 1,524 | 18.6% |
| 4 rooms | 4,155 | 19.9% | 2,878 | 16.4% | 2,733 | 22.7% | 1,975 | 24.1% |
| 5 rooms | 2,490 | 11.9% | 1,731 | 9.9% | 2,122 | 17.6% | 1,714 | 20.9% |
| 6 rooms | 1,236 | 5.9% | 918 | 5.2% | 1,097 | 9.1% | 790 | 9.6% |
| 7 rooms | 622 | 3.0% | 361 | 2.1% | 552 | 4.6% | 265 | 3.2% |
| 8 or more rooms | 929 | 4.5% | 479 | 2.7% | 588 | 4.9% | 258 | 3.1% |
| Median | 3.3 | . . . | 2.9 | . . . | 4.4 | . . . | 4 | . . . |
Ch.9 HOUSING
To download HD image, right click on image and select “Save Image As”…


