DescriptionTable DataChart and Figure Data
Ch.9 HOUSING
Ch.9 HOUSING
SY 2017 Table 9.26 Source of Water by District and Island, CNMI: 2010
Statistical Yearbook 2017 CNMI CSD
Universe: Total housing units
| Saipan District 1 |
Saipan District 2 |
Saipan District 3 |
Saipan District 4 |
Saipan District 5 |
Tinian District 6 |
Rota District 7 |
|
|---|---|---|---|---|---|---|---|
| Source: U.S. Census Bureau | |||||||
| Public system only | 4,296 | 2,081 | 5,031 | 985 | 1,890 | 1,087 | 1,035 |
| Public system and catchment | 1,097 | 424 | 1,561 | 339 | 556 | 22 | 7 |
| Individual well | 49 | 12 | 104 | 36 | 19 | – | – |
| Catchment, tanks, or drums only | 22 | 6 | 67 | 16 | 39 | 8 | 4 |
| Some other source | 15 | 4 | 12 | 3 | 19 | 1 | 3 |
SY 2017 Table 9.27 Source of Water, CNMI: 1990 to 2010
Statistical Yearbook 2017 CNMI CSD
| 2010 | 2010 | 2000 to 2010 | 2000 | 2000 | 1995 to 2000 | 1995 | 1995 | 1990 to 1995 | 1990 | 1990 | |
|---|---|---|---|---|---|---|---|---|---|---|---|
| Source: 1990 CPH-6-CNMI Table 105, 1995 CNMI Mid-Decade Census Table 151 and Census 2000 Population and Housing Profiles | |||||||||||
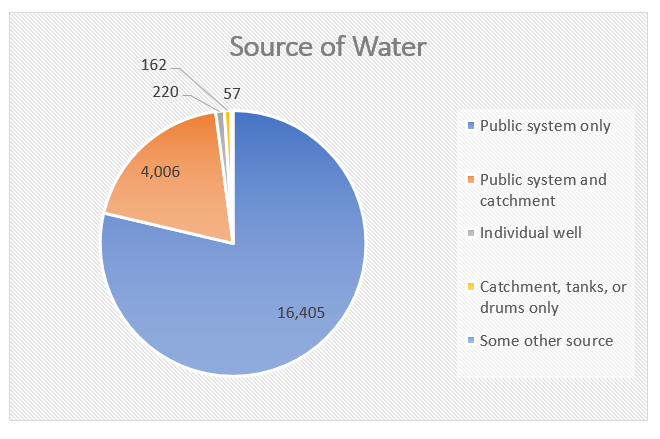
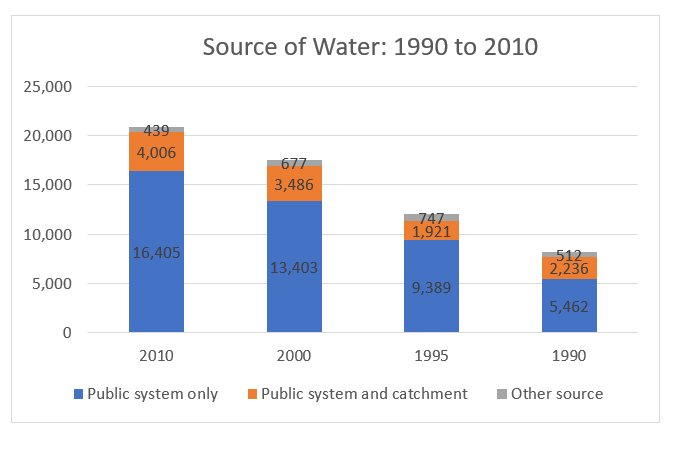
| Public system only | 16,405 | 78.7% | 22.4% | 13,403 | 73.5% | 42.8% | 9,389 | 73.3% | 71.9% | 5,462 | 62.6% |
| Public system and catchment | 4,006 | 19.2% | 14.9% | 3,486 | 19.1% | 81.5% | 1,921 | 15.0% | -14.1% | 2,236 | 25.6% |
| Other source | 439 | 677 | 747 | 512 | |||||||
| Individual well | 220 | 1.1% | 94.7% | 113 | 0.6% | 0.0% | – | 0.0% | -100.0% | 123 | 1.4% |
| Catchment, tanks, or drums only | 162 | 0.8% | -56.1% | 369 | 2.0% | -19.1% | 456 | 3.6% | 70.8% | 267 | 3.1% |
| Other source | 57 | 0.3% | -70.8% | 195 | 1.1% | -33.0% | 291 | 2.3% | 138.5% | 122 | 1.4% |
SY 2017 Table 9.28 Source of Water by Island: 1990 to 2010 (SAIPAN)
Statistical Yearbook 2017 CNMI CSD
Universe: Total housing units
| Saipan | 2010 | 2000 | 1995 | 1990 |
|---|---|---|---|---|
| Source: 1990 CPH-6-CNMI Table 105, 1995 CNMI Mid-Decade Census Table 151, Census 2000 Population & Housing Profiles | ||||
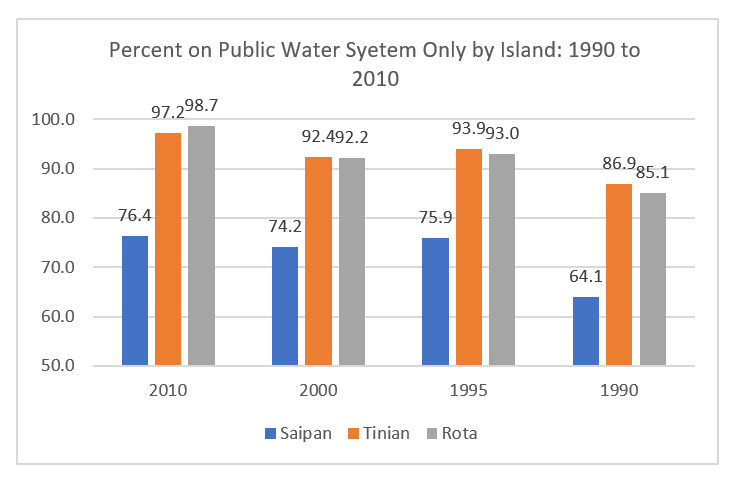
| Public system only | 14,283 | 11,523 | 8,232 | 4,646 |
| Public system and catchment | 3,977 | 3,417 | 1,909 | 2,212 |
| Individual well | 220 | 109 | – | 121 |
| Catchment, tanks, or drums only | 150 | 332 | 437 | 151 |
| Other source | 53 | 146 | 266 | 121 |
SY 2017 Table 9.28 Source of Water by Island: 1990 to 2010 (TINIAN)
Statistical Yearbook 2017 CNMI CSD
Universe: Total housing units
| Tinian | 2010 | 2000 | 1995 | 1990 |
|---|---|---|---|---|
| Source: 1990 CPH-6-CNMI Table 105, 1995 CNMI Mid-Decade Census Table 151, Census 2000 Population & Housing Profiles | ||||
| Public system only | 1,087 | 975 | 511 | 373 |
| Public system and catchment | 22 | 49 | 4 | 14 |
| Individual well | – | 2 | – | 1 |
| Catchment, tanks, or drums only | 8 | 16 | 10 | 41 |
| Other source | 1 | 13 | 19 | – |
SY 2017 Table 9.28 Source of Water by Island: 1990 to 2010 (ROTA)
Statistical Yearbook 2017 CNMI CSD
Universe: Total housing units
| Rota | 2010 | 2000 | 1995 | 1990 |
|---|---|---|---|---|
| Source: 1990 CPH-6-CNMI Table 105, 1995 CNMI Mid-Decade Census Table 151, Census 2000 Population & Housing Profiles | ||||
| Public system only | 1,035 | 904 | 642 | 433 |
| Public system and catchment | 7 | 18 | 6 | 10 |
| Individual well | – | 2 | – | 1 |
| Catchment, tanks, or drums only | 4 | 21 | 19 | 65 |
| Other source | 3 | 36 | 23 | – |
Ch.9 HOUSING
To download HD image, right click on image and select “Save Image As”…