DescriptionTable DataChart and Figure Data
Ch.9 HOUSING
Ch.9 HOUSING
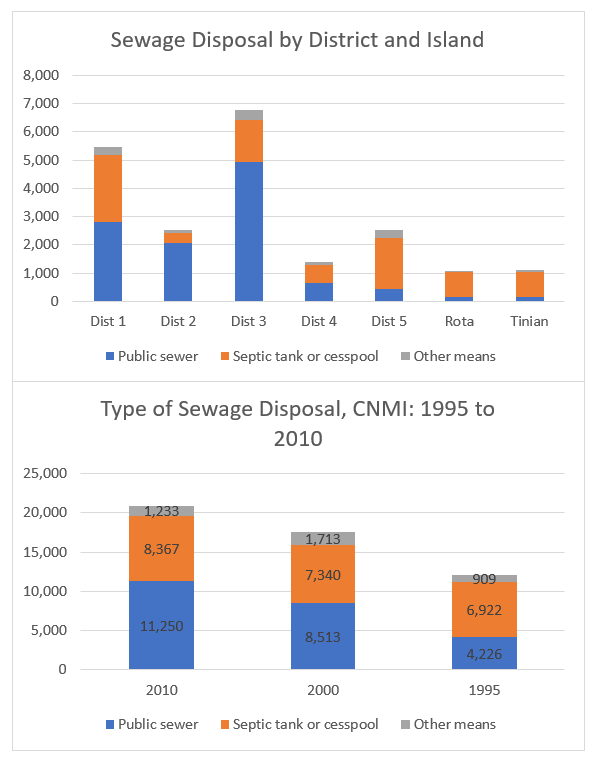
SY 2017 Table 9.29 Sewage Disposal by District and Island, CNMI: 2010
Statistical Yearbook 2017 CNMI CSD
Universe: Total housing units
| Saipan District 1 |
Saipan District 2 |
Saipan District 3 |
Saipan District 4 |
Saipan District 5 |
Tinian District 6 |
Rota District 7 |
|
|---|---|---|---|---|---|---|---|
| Source: U.S. Census Bureau | |||||||
| Public sewer | 2,825 | 2,072 | 4,933 | 653 | 435 | 161 | 171 |
| Septic tank or cesspool | 2,351 | 352 | 1,490 | 638 | 1,818 | 862 | 856 |
| Other means | 303 | 103 | 352 | 88 | 270 | 95 | 22 |
SY 2017 Table 9.30 Sewage Disposal by Island, CNMI: 2010
Statistical Yearbook 2017 CNMI CSD
Universe: Total housing units
| 2010 | Saipan | Rota | Tinian |
|---|---|---|---|
| Source: U.S. Census Bureau | |||
| Public sewer | 10,918 | 171 | 161 |
| Septic tank or cesspool | 6,649 | 856 | 862 |
| Other means | 1,116 | 22 | 95 |
SY 2017 Table 9.30 Sewage Disposal by Island, CNMI: 2000
Statistical Yearbook 2017 CNMI CSD
Universe: Total housing units
| 2000 | Saipan | Rota | Tinian |
|---|---|---|---|
| Source: U.S. Census Bureau | |||
| Public sewer | 8,168 | 93 | 252 |
| Septic tank or cesspool | 5,926 | 765 | 649 |
| Other means | 1,436 | 123 | 154 |
SY 2017 Table 9.30 Sewage Disposal by Island, CNMI: 1995
Statistical Yearbook 2017 CNMI CSD
Universe: Total housing units
| 1995 | Saipan | Rota | Tinian |
|---|---|---|---|
| Source: U.S. Census Bureau | |||
| Public sewer | 4,174 | 17 | 35 |
| Septic tank or cesspool | 5,852 | 608 | 461 |
| Other means | 818 | 65 | 26 |
Ch.9 HOUSING
To download HD image, right click on image and select “Save Image As”…


