DescriptionTable DataChart and Figure Data
Ch.9 HOUSING
Ch.9 HOUSING
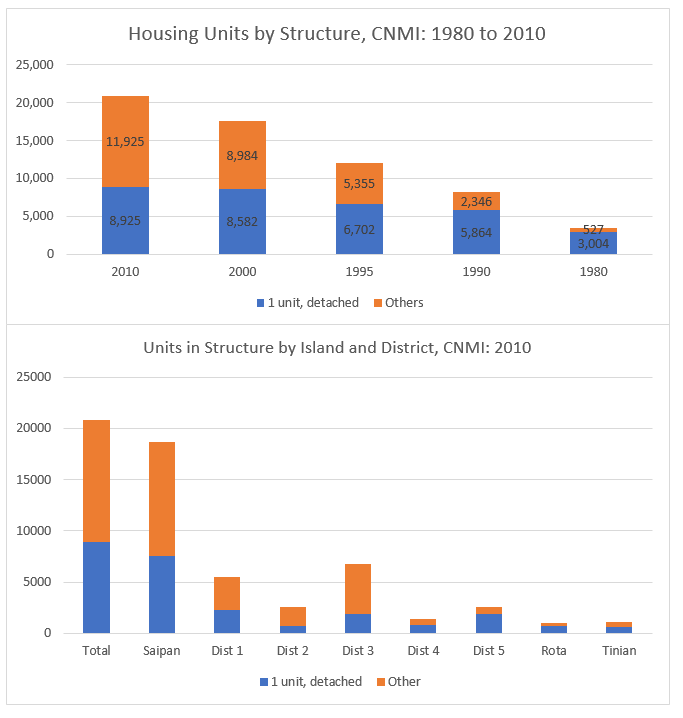
SY 2017 Table 9.3 Housing Units in Structure, CNMI: 1980 to 2010
Statistical Yearbook 2017 CNMI CSD
Note: Units in Numbers and Percentage
| Units in Structure | 2010 | 2010 | 2000 | 2000 | 1995 | 1995 | 1990 | 1990 | 1980 | 1980 |
|---|---|---|---|---|---|---|---|---|---|---|
| Source: 1980 Census Table 9, 1990 CPH-6 CNMI Table 101, 1990 CPH-6-CNMI Table 105, 1995 CNMI Mid-Decade Census Table 147 and Census 2000 Population and Housing Profiles | ||||||||||
| 1, detached | 8,925 | 42.8% | 8,582 | 48.9% | 6,702 | 55.6% | 5,864 | 71.4% | 3,004 | 85.1% |
| 1, attached | 3,185 | 15.3% | 2,366 | 13.5% | 1,520 | 12.6% | 850 | 10.4% | 62 | 1.8% |
| 2 | 587 | 2.8% | 522 | 3.0% | 286 | 2.4% | 126 | 1.5% | 82 | 2.3% |
| 3 or 4 | 1,333 | 6.4% | 1,324 | 7.5% | 717 | 5.9% | 445 | 5.4% | 67 | 1.9% |
| 5 to 9 | 2,266 | 10.9% | 2,022 | 11.5% | 1,083 | 9.0% | 431 | 5.2% | 148 | 4.2% |
| 10 to 19 | 2,578 | 12.4% | 1,512 | 8.6% | 671 | 5.6% | 276 | 3.4% | 148 | 4.2% |
| 20 or more | 1,830 | 8.8% | 1,106 | 6.3% | 466 | 3.9% | 71 | 0.9% | 2 | 0.1% |
| Other | 146 | 0.7% | 132 | 0.8% | 612 | 5.1% | 147 | 1.8% | 18 | 0.5% |
SY 2017 Table 9.4 Units in Structure by District and Island, CNMI: 2010
Statistical Yearbook 2017 CNMI CSD
Universe: Total housing units
| Saipan District 1 |
Saipan District 2 |
Saipan District 3 |
Saipan District 4 |
Saipan District 5 |
Tinian District 6 |
Rota District 7 |
|
|---|---|---|---|---|---|---|---|
| Source: U.S. Census Bureau | |||||||
| 1 unit, detached | 2,326 | 671 | 1,846 | 818 | 1,917 | 637 | 710 |
| 1 unit, attached | 1,119 | 525 | 858 | 146 | 227 | 190 | 120 |
| 2 units | 155 | 76 | 189 | 53 | 42 | 41 | 31 |
| 3 or 4 units | 289 | 239 | 531 | 64 | 72 | 84 | 54 |
| 5 to 9 units | 433 | 490 | 952 | 157 | 73 | 81 | 80 |
| 10 to 19 units | 668 | 425 | 1,166 | 94 | 116 | 58 | 51 |
| 20 or more units | 451 | 89 | 1,180 | 44 | 56 | 10 | – |
| Mobile home | 17 | 9 | 24 | 1 | 12 | – | – |
| Container | 17 | 1 | 23 | 2 | 7 | 14 | 3 |
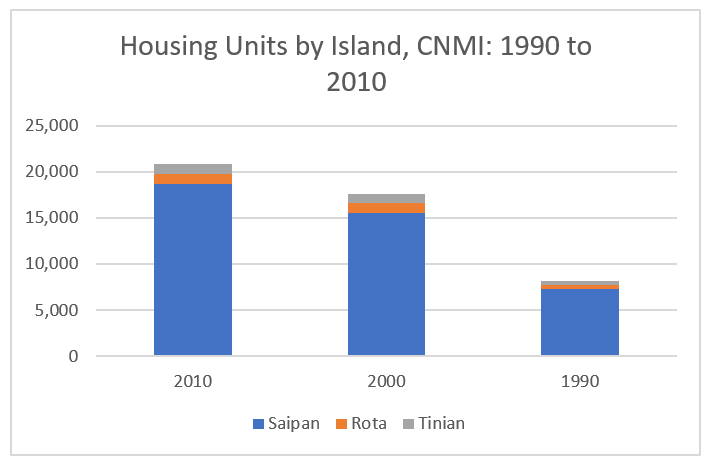
SY 2017 Table 9.5 Units in Structure by Island, CNMI: 2010
Statistical Yearbook 2017 CNMI CSD
Universe: Total housing units
| 2010 | Saipan | Rota | Tinian |
|---|---|---|---|
| Source: U.S. Census Bureau | |||
| 1 unit, detached | 7,578 | 710 | 637 |
| 1 unit, attached | 2,875 | 120 | 190 |
| 2 units | 515 | 31 | 41 |
| 3 or 4 units | 1,195 | 54 | 84 |
| 5 to 9 units | 2,105 | 80 | 81 |
| 10 to 19 units | 2,469 | 51 | 58 |
| 20 or more units | 1,820 | – | 10 |
| Other | 113 | 3 | 14 |
SY 2017 Table 9.5 Units in Structure by Island, CNMI: 2000
Statistical Yearbook 2017 CNMI CSD
Universe: Total housing units
| 2000 | Saipan | Rota | Tinian |
|---|---|---|---|
| Source: U.S. Census Bureau | |||
| 1 unit, detached | 7,229 | 595 | 755 |
| 1 unit, attached | 2,136 | 124 | 106 |
| 2 units | 463 | 41 | 18 |
| 3 or 4 units | 1,242 | 47 | 35 |
| 5 to 9 units | 1,835 | 143 | 44 |
| 10 to 19 units | 1,421 | 75 | 16 |
| 20 or more units | 1,101 | 5 | – |
| Other | 100 | 25 | 7 |
SY 2017 Table 9.5 Units in Structure by Island, CNMI: 1990
Statistical Yearbook 2017 CNMI CSD
Universe: Total housing units
| 1990 | Saipan | Rota | Tinian |
|---|---|---|---|
| Source: 1990 CPH-6-CNMI Table 105, 2000 and 2010 Population and Housing Censuses | |||
| 1 unit, detached | 4,993 | 475 | 385 |
| 1 unit, attached | 801 | 22 | 27 |
| 2 units | 121 | 3 | 2 |
| 3 or 4 units | 433 | 7 | 5 |
| 5 to 9 units | 417 | 7 | 7 |
| 10 to 19 units | 276 | – | – |
| 20 or more units | 81 | 1 | – |
| Other | 129 | 4 | 3 |
Ch.9 HOUSING
To download HD image, right click on image and select “Save Image As”…


