DescriptionTable DataChart and Figure Data
Ch.9 HOUSING
Ch.9 HOUSING
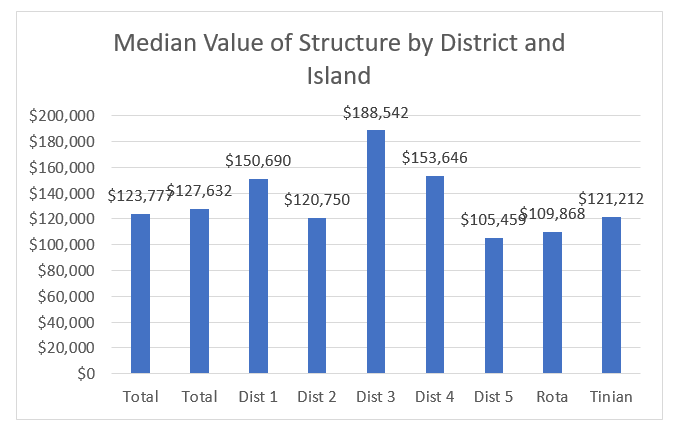
SY 2017 Table 9.33 Value of structure by District and Island, CNMI: 2010
Statistical Yearbook 2017 CNMI CSD
Universe: Owner-occupied housing units
| Saipan District 1 |
Saipan District 2 |
Saipan District 3 |
Saipan District 4 |
Saipan District 5 |
Tinian District 6 |
Rota District 7 |
|
|---|---|---|---|---|---|---|---|
| Source: U.S. Census Bureau | |||||||
| Less than $40,000 | 81 | 36 | 52 | 33 | 89 | 15 | 21 |
| $40,000 to $49,999 | 21 | 7 | 13 | 10 | 27 | 5 | 8 |
| $50,000 to $59,999 | 71 | 28 | 48 | 24 | 86 | 26 | 28 |
| $60,000 to $69,999 | 32 | 7 | 30 | 9 | 48 | 11 | 21 |
| $70,000 to $79,999 | 70 | 18 | 38 | 23 | 65 | 19 | 26 |
| $80,000 to $89,999 | 72 | 19 | 50 | 17 | 113 | 14 | 24 |
| $90,000 to $99,999 | 27 | 2 | 16 | 13 | 27 | 6 | 13 |
| $100,000 to $149,999 | 220 | 60 | 155 | 91 | 173 | 75 | 62 |
| $150,000 to $199,999 | 179 | 40 | 89 | 59 | 115 | 41 | 39 |
| $200,000 to $299,999 | 166 | 38 | 151 | 47 | 101 | 39 | 40 |
| $300,000 to $399,999 | 97 | 14 | 66 | 37 | 43 | 13 | 9 |
| $400,000 to $499,999 | 18 | 4 | 39 | 11 | 18 | 3 | 7 |
| $500,000 or more | 142 | 44 | 213 | 80 | 74 | 37 | 29 |
| Median | $150,690 | $120,750 | $188,542 | $153,646 | $105,459 | $121,212 | $109,868 |
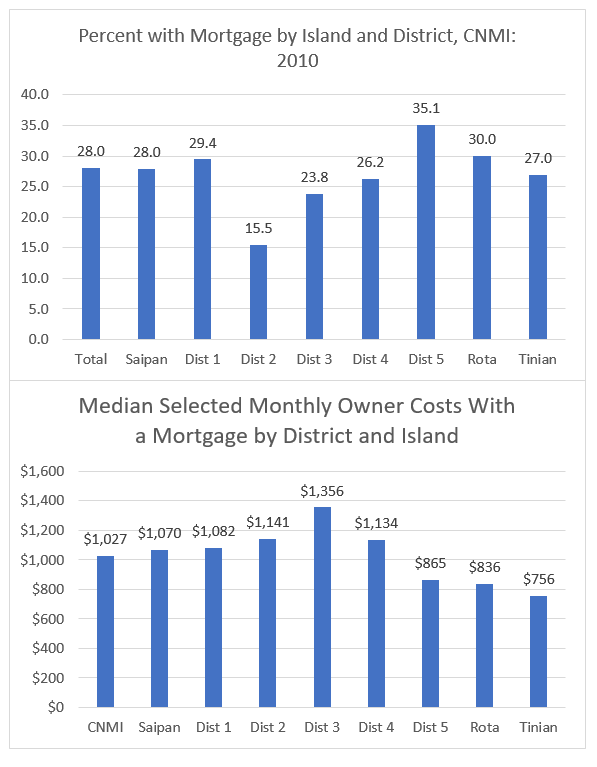
SY 2017 Table 9.34 Mortgage Status by Selected Monthly Owner Costs and District and Island, CNMI: 2010
Statistical Yearbook 2017 CNMI CSD
Universe: Owner-occupied housing units
| Saipan District 1 |
Saipan District 2 |
Saipan District 3 |
Saipan District 4 |
Saipan District 5 |
Tinian District 6 |
Rota District 7 |
|
|---|---|---|---|---|---|---|---|
| Source: U.S. Census Bureau | |||||||
| Less than $500 | 33 | 2 | 11 | 11 | 54 | 10 | 18 |
| $500 to $599 | 18 | 2 | 4 | 9 | 31 | 12 | 9 |
| $600 to $699 | 20 | 3 | 8 | 8 | 30 | 14 | 6 |
| $700 to $799 | 28 | 6 | 14 | 9 | 35 | 9 | 12 |
| $800 to $899 | 30 | 5 | 11 | 2 | 34 | 10 | 11 |
| $900 to $999 | 26 | 2 | 17 | 6 | 23 | 6 | 4 |
| $1,000 to $1,249 | 64 | 8 | 35 | 27 | 59 | 10 | 12 |
| $1,250 to $1,499 | 52 | 9 | 33 | 15 | 23 | 7 | 10 |
| $1,500 to $1,749 | 33 | 2 | 29 | 10 | 21 | 3 | 5 |
| $1,750 to $1,999 | 20 | 3 | 17 | 6 | 9 | 1 | 2 |
| $2,000 to $2,499 | 18 | 3 | 23 | 10 | 13 | 0 | 4 |
| $2,500 to $2,999 | 1 | 2 | 10 | 2 | 3 | 0 | 1 |
| $3,000 or more | 9 | 2 | 16 | 4 | 9 | 0 | 4 |
| Without a mortgage | 844 | 268 | 732 | 335 | 635 | 222 | 229 |
SY 2017 Table 9.35 Median Selected Monthly Owner Costs by District and Island, CNMI: 2010
Statistical Yearbook 2017 CNMI CSD
Universe: Owner-occupied housing units
| Saipan District 1 |
Saipan District 2 |
Saipan District 3 |
Saipan District 4 |
Saipan District 5 |
Tinian District 6 |
Rota District 7 |
|
|---|---|---|---|---|---|---|---|
| Source: U.S. Census Bureau | |||||||
| Total Units | 1,196 | 317 | 960 | 454 | 979 | 304 | 327 |
| With a mortgage | $1,082 | $1,141 | $1,356 | $1,134 | $865 | $756 | $836 |
| Without a mortgage | $251 | $256 | $265 | $244 | $215 | $286 | $267 |
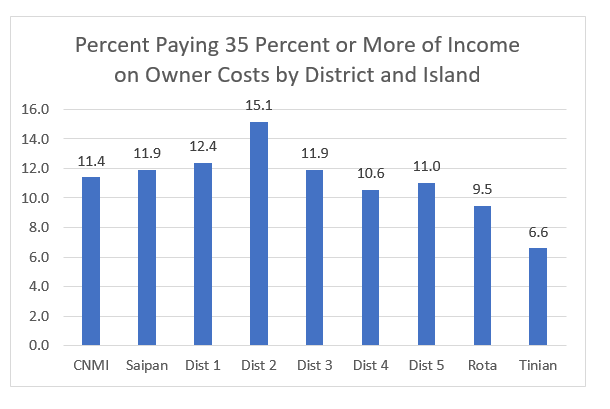
SY 2017 Table 9.36 Selected Monthly Owner Costs as a percentage of Household Income in 2009 by District and Island, CNMI: 2010
Statistical Yearbook 2017 CNMI CSD
Universe: Owner-occupied housing units
| Saipan District 1 |
Saipan District 2 |
Saipan District 3 |
Saipan District 4 |
Saipan District 5 |
Tinian District 6 |
Rota District 7 |
|
|---|---|---|---|---|---|---|---|
| Source: U.S. Census Bureau | |||||||
| Less than 10.0 percent | 477 | 121 | 405 | 183 | 359 | 145 | 115 |
| 10.0 to 14.9 percent | 180 | 53 | 159 | 73 | 172 | 63 | 74 |
| 15.0 to 19.9 percent | 127 | 39 | 99 | 48 | 113 | 41 | 35 |
| 20.0 to 24.9 percent | 104 | 14 | 65 | 33 | 97 | 18 | 35 |
| 25.0 to 29.9 percent | 64 | 15 | 59 | 31 | 59 | 9 | 19 |
| 30.0 to 34.9 percent | 46 | 10 | 25 | 16 | 46 | 5 | 17 |
| 35.0 percent or more | 148 | 48 | 114 | 48 | 108 | 20 | 31 |
| Not computed | 50 | 17 | 34 | 22 | 25 | 3 | 1 |
Ch.9 HOUSING
To download HD image, right click on image and select “Save Image As”…


