DescriptionTable DataChart and Figure Data
Ch.9 HOUSING
Ch.9 HOUSING
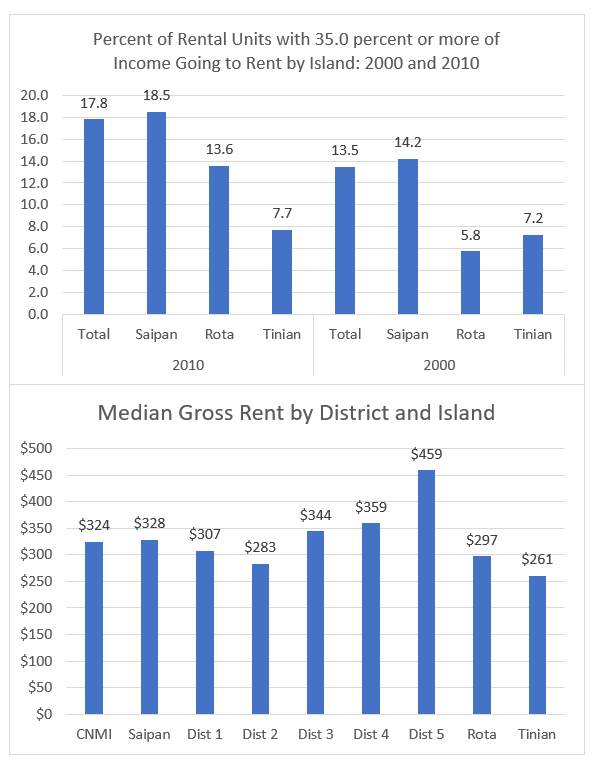
SY 2017 Table 9.38 Gross Rent by District and Island, CNMI: 2010
Statistical Yearbook 2017 CNMI CSD
Universe: Renter-occupied housing units
| Saipan District 1 |
Saipan District 2 |
Saipan District 3 |
Saipan District 4 |
Saipan District 5 |
Tinian District 6 |
Rota District 7 |
|
|---|---|---|---|---|---|---|---|
| Source: U.S. Census Bureau | |||||||
| Less than $200 | 749 | 464 | 866 | 127 | 91 | 141 | 61 |
| $200 to $299 | 430 | 280 | 602 | 53 | 80 | 66 | 54 |
| $300 to $399 | 339 | 192 | 503 | 63 | 61 | 54 | 27 |
| $400 to $499 | 257 | 144 | 388 | 41 | 77 | 35 | 26 |
| $500 to $599 | 197 | 106 | 284 | 34 | 53 | 19 | 17 |
| $600 to $699 | 122 | 47 | 229 | 30 | 42 | 20 | 11 |
| $700 to $799 | 91 | 45 | 151 | 21 | 41 | 9 | 9 |
| $800 to $899 | 60 | 34 | 111 | 16 | 35 | 6 | 4 |
| $900 to $999 | 39 | 29 | 80 | 16 | 18 | 4 | 7 |
| $1,000 to $1,249 | 68 | 33 | 104 | 23 | 19 | 3 | 7 |
| $1,250 to $1,499 | 31 | 10 | 49 | 8 | 16 | 0 | 3 |
| $1,500 or more | 28 | 16 | 56 | 10 | 12 | 0 | 1 |
| No rent paid | 680 | 293 | 800 | 170 | 336 | 213 | 201 |
| Median | $307 | $283 | $344 | $359 | $459 | $261 | $297 |
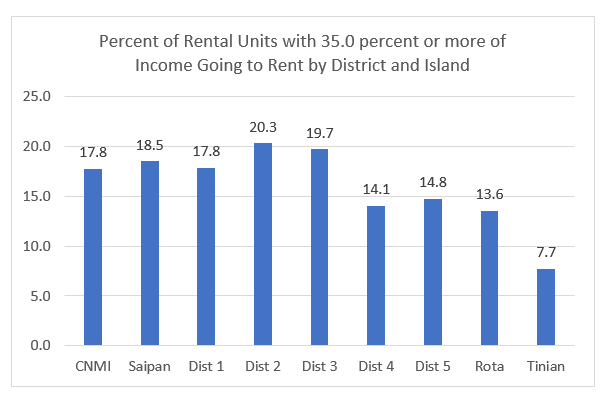
SY 2017 Table 9.39 Gross Rent as percentage of Household Income in 2009 by District and Island, CNMI: 2010
Statistical Yearbook 2017 CNMI CSD
Universe: Renter-occupied housing units
| Saipan District 1 |
Saipan District 2 |
Saipan District 3 |
Saipan District 4 |
Saipan District 5 |
Tinian District 6 |
Rota District 7 |
|
|---|---|---|---|---|---|---|---|
| Source: U.S. Census Bureau | |||||||
| Less than 10.0 percent | 283 | 122 | 331 | 53 | 76 | 74 | 26 |
| 10.0 to 14.9 percent | 434 | 241 | 541 | 84 | 106 | 102 | 46 |
| 15.0 to 19.9 percent | 391 | 232 | 614 | 82 | 89 | 69 | 41 |
| 20.0 to 24.9 percent | 300 | 194 | 462 | 60 | 60 | 22 | 26 |
| 25.0 to 29.9 percent | 196 | 127 | 328 | 36 | 35 | 23 | 14 |
| 30.0 to 34.9 percent | 135 | 79 | 224 | 31 | 32 | 17 | 11 |
| 35.0 percent or more | 551 | 344 | 833 | 86 | 130 | 44 | 58 |
| Not computed | 801 | 354 | 890 | 180 | 353 | 219 | 206 |
SY 2017 Table 9.40 Gross Rent as percentage of Household Income in 2009 by District and Island, CNMI: 2010
Statistical Yearbook 2017 CNMI CSD
Universe: Renter-occupied housing units
| 2010 | Saipan | Rota | Tinian |
|---|---|---|---|
| Source: U.S. Census Bureau | |||
| Less than 10.0 percent | 865 | 26 | 74 |
| 10.0 to 14.9 percent | 1,406 | 46 | 102 |
| 15.0 to 19.9 percent | 1,408 | 41 | 69 |
| 20.0 to 24.9 percent | 1,076 | 26 | 22 |
| 25.0 to 29.9 percent | 722 | 14 | 23 |
| 30.0 to 34.9 percent | 501 | 11 | 17 |
| 35.0 percent or more | 1,944 | 58 | 44 |
| Not computed | 2,578 | 206 | 219 |
SY 2017 Table 9.40 Gross Rent as percentage of Household Income in 1999 by District and Island, CNMI: 2000
Statistical Yearbook 2017 CNMI CSD
Universe: Renter-occupied housing units
| 2000 | Saipan | Rota | Tinian |
|---|---|---|---|
| Source: U.S. Census Bureau | |||
| Less than 10.0 percent | 993 | 41 | 45 |
| 10.0 to 14.9 percent | 1,186 | 32 | 59 |
| 15.0 to 19.9 percent | 1,088 | 19 | 36 |
| 20.0 to 24.9 percent | 745 | 14 | 16 |
| 25.0 to 29.9 percent | 511 | 10 | 19 |
| 30.0 to 34.9 percent | 296 | 7 | 8 |
| 35.0 percent or more | 1,224 | 21 | 37 |
| Not computed | 2,586 | 221 | 291 |
Ch.9 HOUSING
To download HD image, right click on image and select “Save Image As”…