DescriptionTable DataChart and Figure Data
Ch.9 HOUSING
Ch.9 HOUSING
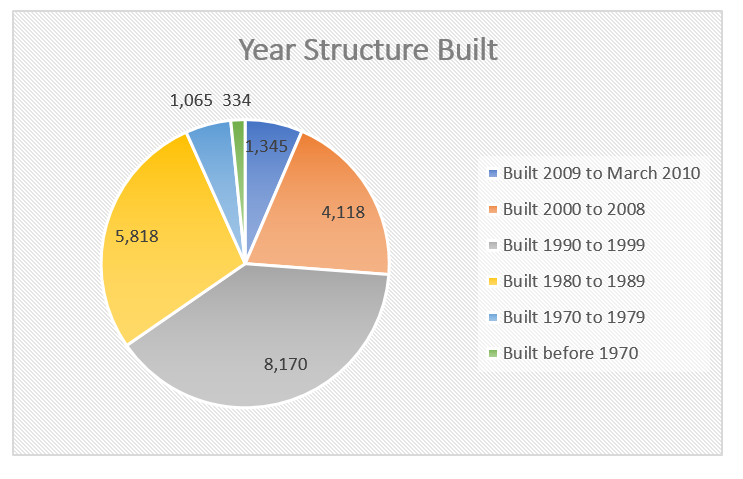
SY 2017 Table 9.6 Year Structure Built by District and Island, CNMI: 2010
Statistical Yearbook 2017 CNMI CSD
Universe: Total housing units
| Saipan District 1 |
Saipan District 2 |
Saipan District 3 |
Saipan District 4 |
Saipan District 5 |
Tinian District 6 |
Rota District 7 |
|
|---|---|---|---|---|---|---|---|
| Source: U.S. Census Bureau | |||||||
| Built 2009 to March 2010 | 253 | 373 | 456 | 69 | 131 | 47 | 16 |
| Built 2000 to 2008 | 1,252 | 376 | 1,017 | 186 | 746 | 315 | 226 |
| Built 1990 to 1999 | 2,166 | 975 | 2,415 | 592 | 1,159 | 464 | 399 |
| Built 1980 to 1989 | 1,518 | 551 | 2,378 | 435 | 393 | 257 | 286 |
| Built 1970 to 1979 | 213 | 165 | 424 | 73 | 79 | 28 | 83 |
| Built 1960 to 1969 | 61 | 62 | 68 | 21 | 8 | 5 | 36 |
| Built 1950 to 1959 | 9 | 10 | 4 | 1 | 7 | 1 | 3 |
| Built 1940 to 1949 | 3 | 7 | 8 | 1 | – | 1 | – |
| Built 1939 or earlier | 4 | 8 | 5 | 1 | – | – | – |
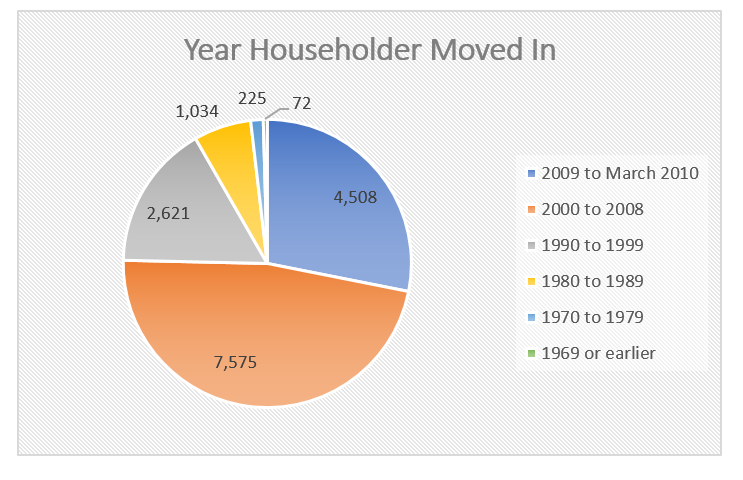
SY 2017 Table 9.7 Year Householder Moved into Unit by District and Island, CNMI: 2010
Statistical Yearbook 2017 CNMI CSD
Universe: Occupied housing units
| Saipan District 1 |
Saipan District 2 |
Saipan District 3 |
Saipan District 4 |
Saipan District 5 |
Tinian District 6 |
Rota District 7 | |
|---|---|---|---|---|---|---|---|
| Source: U.S. Census Bureau | |||||||
| 2009 to March 2010 | 1,164 | 724 | 1,647 | 225 | 347 | 256 | 145 |
| 2000 to 2008 | 1,963 | 935 | 2,543 | 453 | 945 | 389 | 347 |
| 1990 to 1999 | 774 | 197 | 621 | 254 | 450 | 157 | 168 |
| 1980 to 1989 | 319 | 91 | 286 | 107 | 102 | 62 | 67 |
| 1970 to 1979 | 48 | 40 | 74 | 19 | 15 | 8 | 21 |
| 1969 or earlier | 19 | 23 | 12 | 8 | 1 | 2 | 7 |
Ch.9 HOUSING
To download HD image, right click on image and select “Save Image As”…