DescriptionTable DataChart and Figure Data
Ch.9 HOUSING
Ch.9 HOUSING
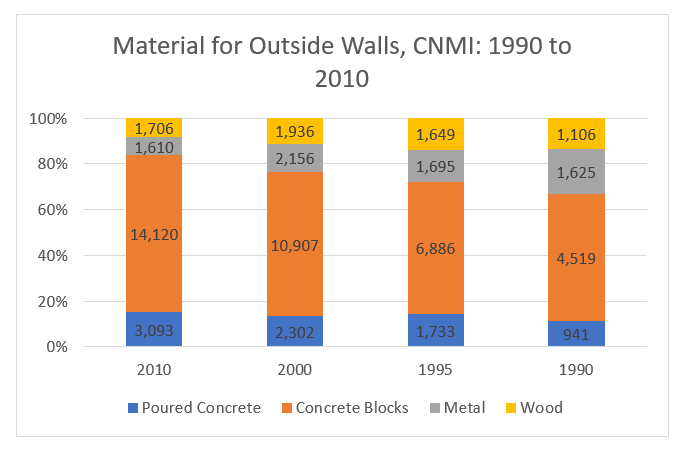
SY 2017 Table 9.8 Material for Outside Walls, CNMI: 1990 to 2010
Statistical Yearbook 2017 CNMI CSD
| 2010 | 2010 | 2000 to 2010 | 2000 | 2000 | 1995 to 2000 | 1995 | 1995 | 1990 to 1995 | 1990 | 1990 | |
|---|---|---|---|---|---|---|---|---|---|---|---|
| Source: 1990 CPH-6-CNMI Table 105, 1995 CNMI Mid-Decade Census Table 148 and Census 2000 Population and Housing | |||||||||||
| Poured Concrete | 3,093 | 14.8% | 34.4% | 2,302 | 13.1% | 32.8% | 1,733 | 14.4% | 84.2% | 941 | 11.5% |
| Concrete Blocks | 14,120 | 67.7% | 29.5% | 10,907 | 62.1% | 58.4% | 6,886 | 57.1% | 52.4% | 4,519 | 55.0% |
| Metal | 1,610 | 7.7% | -25.3% | 2,156 | 12.3% | 27.2% | 1,695 | 14.1% | 4.3% | 1,625 | 19.8% |
| Wood | 1,706 | 8.2% | -11.9% | 1,936 | 11.0% | 17.4% | 1,649 | 13.7% | 49.1% | 1,106 | 13.5% |
| Other | 321 | 1.5% | 21.1% | 265 | 1.5% | 181.9% | 94 | 0.8% | 394.7% | 19 | 0.2% |
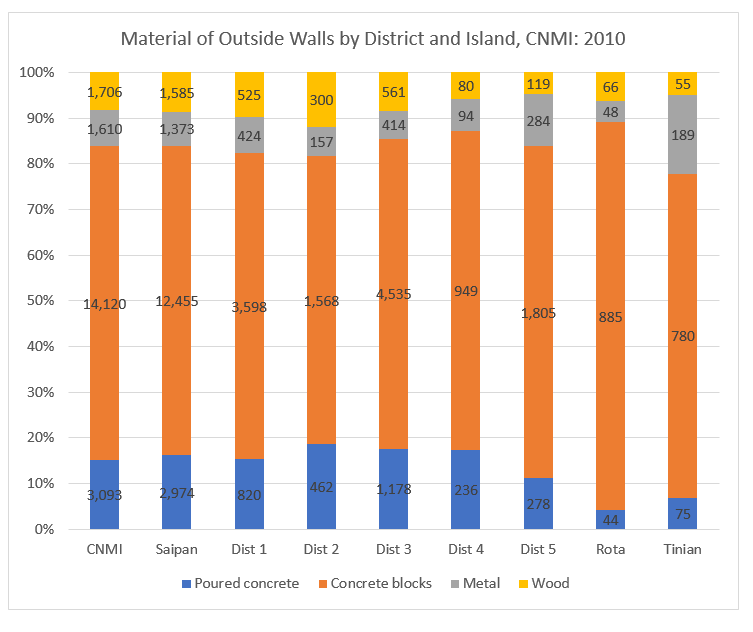
SY 2017 Table 9.9 Material used for Outside Walls by District and Island, CNMI: 2010
Statistical Yearbook 2017 CNMI CSD
Universe: Total housing units
| Saipan District 1 |
Saipan District 2 |
Saipan District 3 |
Saipan District 4 |
Saipan District 5 |
Tinian District 6 |
Rota District 7 |
|
|---|---|---|---|---|---|---|---|
| Source: U.S. Census Bureau | |||||||
| Poured concrete | 820 | 462 | 1,178 | 236 | 278 | 75 | 44 |
| Concrete blocks | 3,598 | 1,568 | 4,535 | 949 | 1,805 | 780 | 885 |
| Metal | 424 | 157 | 414 | 94 | 284 | 189 | 48 |
| Wood | 525 | 300 | 561 | 80 | 119 | 55 | 66 |
| Other | 112 | 40 | 87 | 20 | 37 | 19 | 6 |
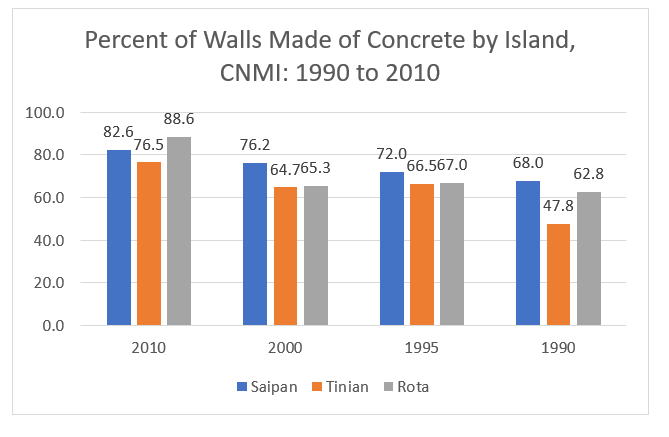
SY 2017 Table 9.10 Material for Outside Walls by Island, CNMI: 1990, 1995 and 2000 (SAIPAN)
Statistical Yearbook 2017 CNMI CSD
| Saipan | 2010 | 2000 | 1995 | 1990 |
|---|---|---|---|---|
| Source: 1990 CPH-6-CNMI Table 105, 1995 CNMI Mid-Decade Census Table 148 and Census 2000 Population and Housing Profiles | ||||
| Poured Concrete | 3,093 | 2,158 | 1,634 | 890 |
| Concrete Blocks | 14,120 | 9,680 | 6,176 | 4,038 |
| Metal | 1,610 | 1,762 | 1,420 | 1,263 |
| Wood | 1,706 | 1,751 | 1,529 | 1,045 |
| Other | 321 | 176 | 85 | 15 |
SY 2017 Table 9.10 Material for Outside Walls by Island, CNMI: 1990, 1995 and 2000 (TINIAN)
Statistical Yearbook 2017 CNMI CSD
| Tinian | 2010 | 2000 | 1995 | 1990 |
|---|---|---|---|---|
| Source: 1990 CPH-6-CNMI Table 105, 1995 CNMI Mid-Decade Census Table 148 and Census 2000 Population and Housing Profiles | ||||
| Poured Concrete | 75 | 97 | 35 | 9 |
| Concrete Blocks | 780 | 586 | 312 | 196 |
| Metal | 189 | 232 | 107 | 195 |
| Wood | 55 | 110 | 66 | 29 |
| Other | 19 | 30 | 2 | – |
SY 2017 Table 9.10 Material for Outside Walls by Island, CNMI: 1990, 1995 and 2000 (ROTA)
Statistical Yearbook 2017 CNMI CSD
| Rota | 2010 | 2000 | 1995 | 1990 |
|---|---|---|---|---|
| Source: 1990 CPH-6-CNMI Table 105, 1995 CNMI Mid-Decade Census Table 148 and Census 2000 Population and Housing Profiles | ||||
| Poured Concrete | 44 | 45 | 64 | 42 |
| Concrete Blocks | 885 | 641 | 398 | 284 |
| Metal | 48 | 162 | 167 | 161 |
| Wood | 66 | 74 | 54 | 28 |
| Other | 6 | 59 | 7 | 4 |
Ch.9 HOUSING
To download HD image, right click on image and select “Save Image As”…