IntroTable DataCharts and Figures Data
Economic Indicator
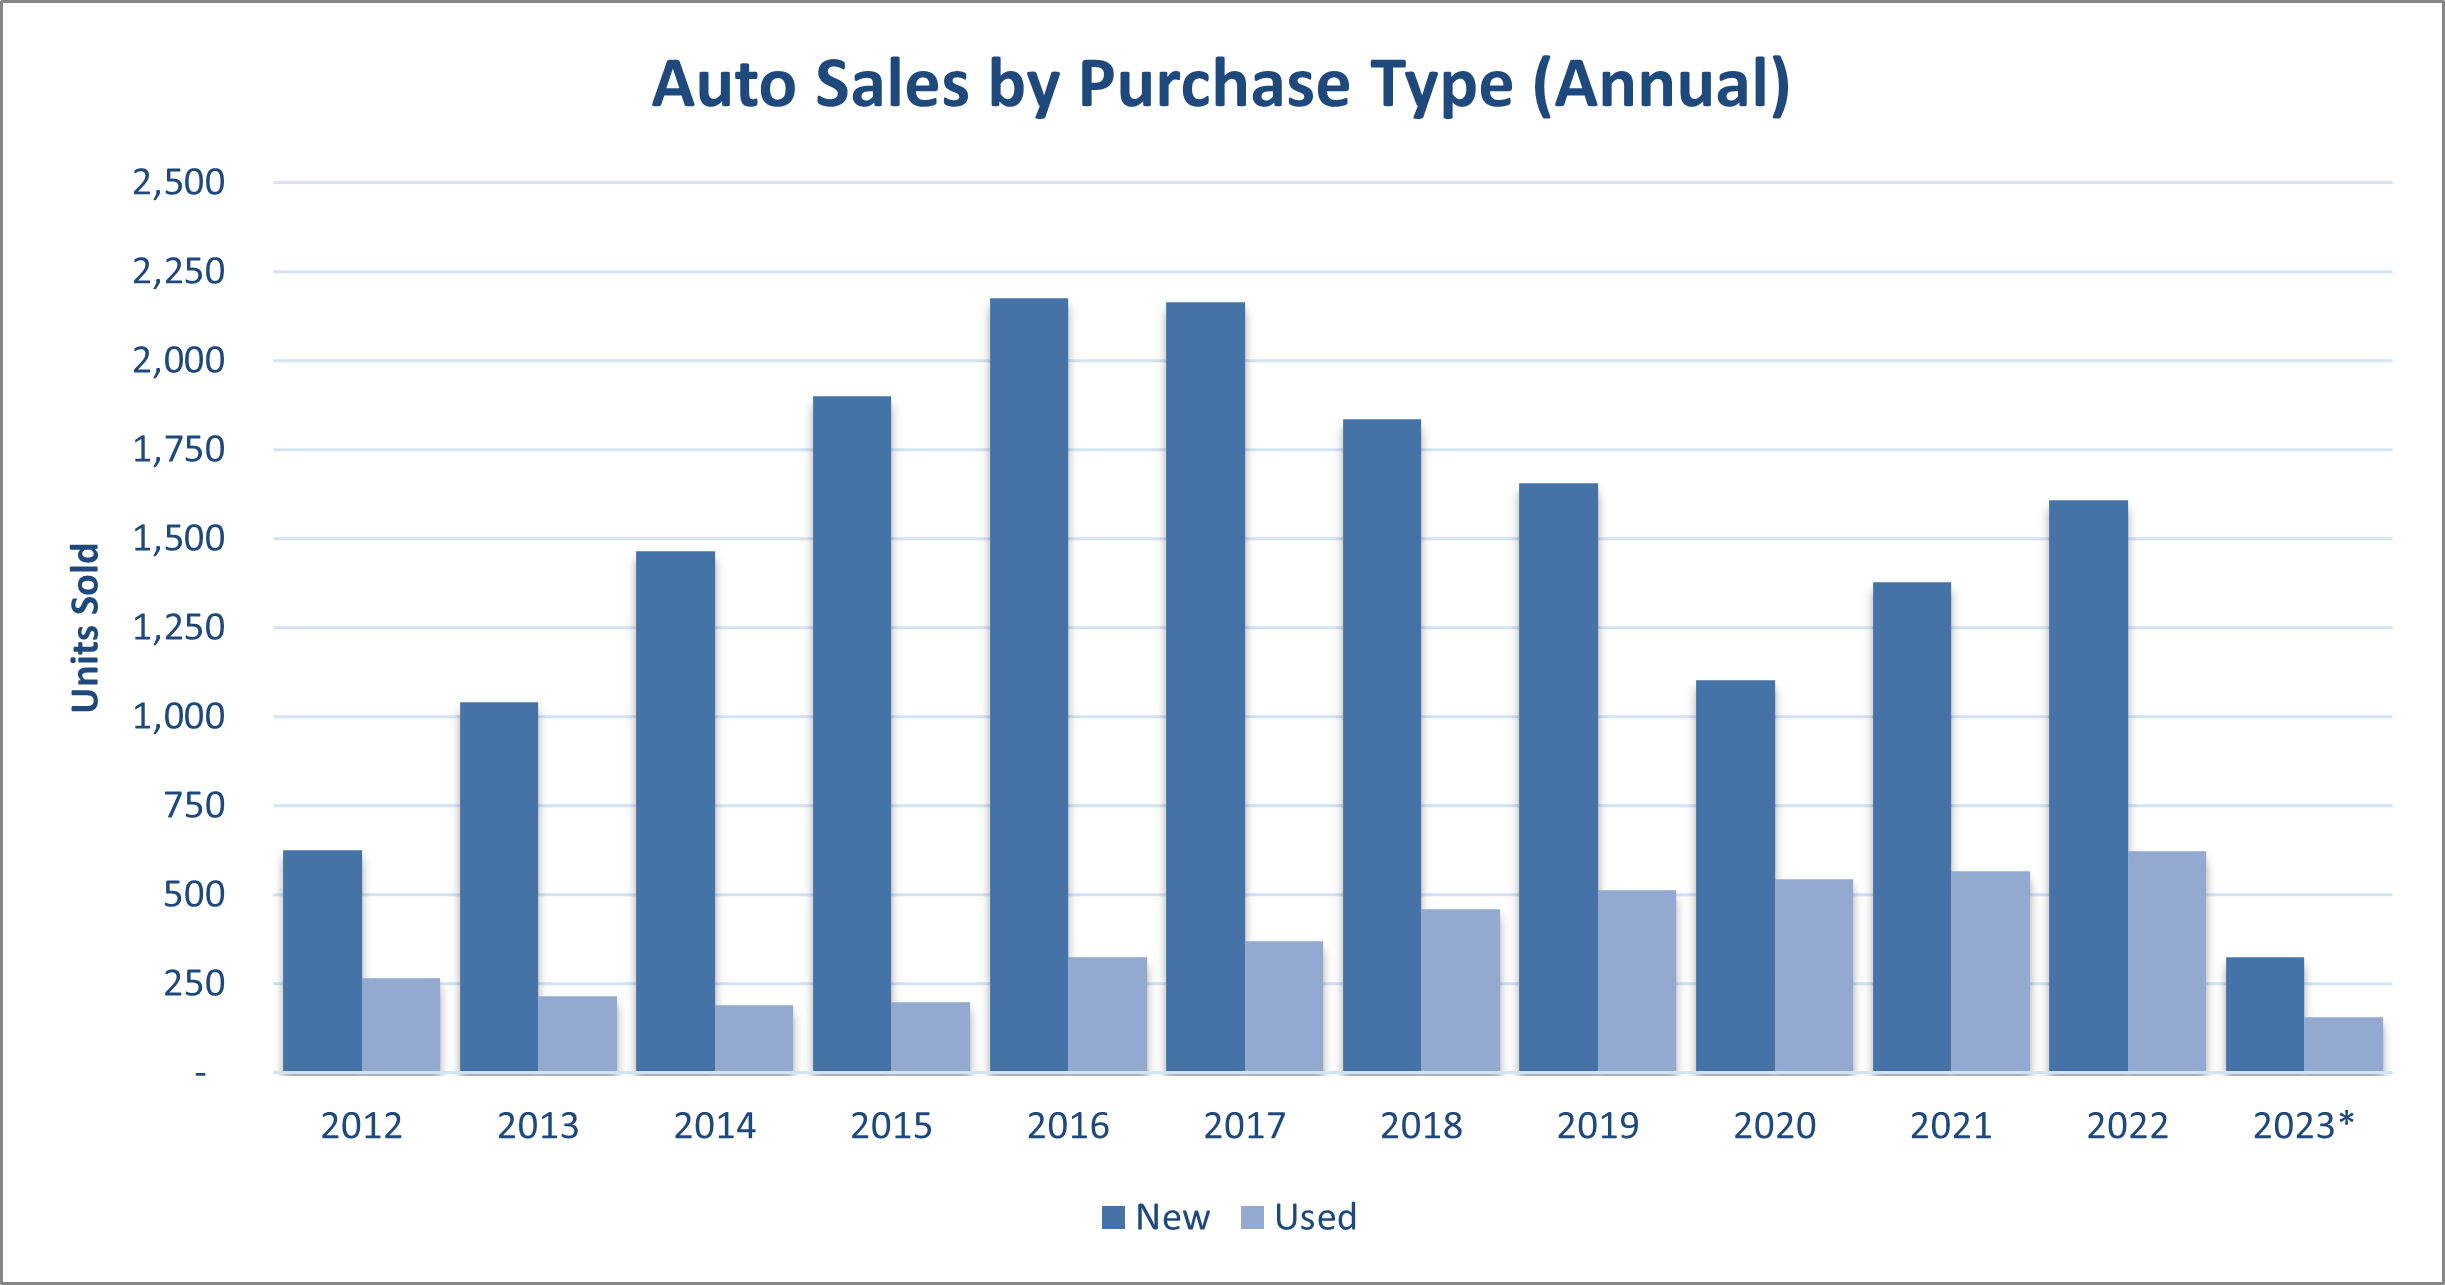
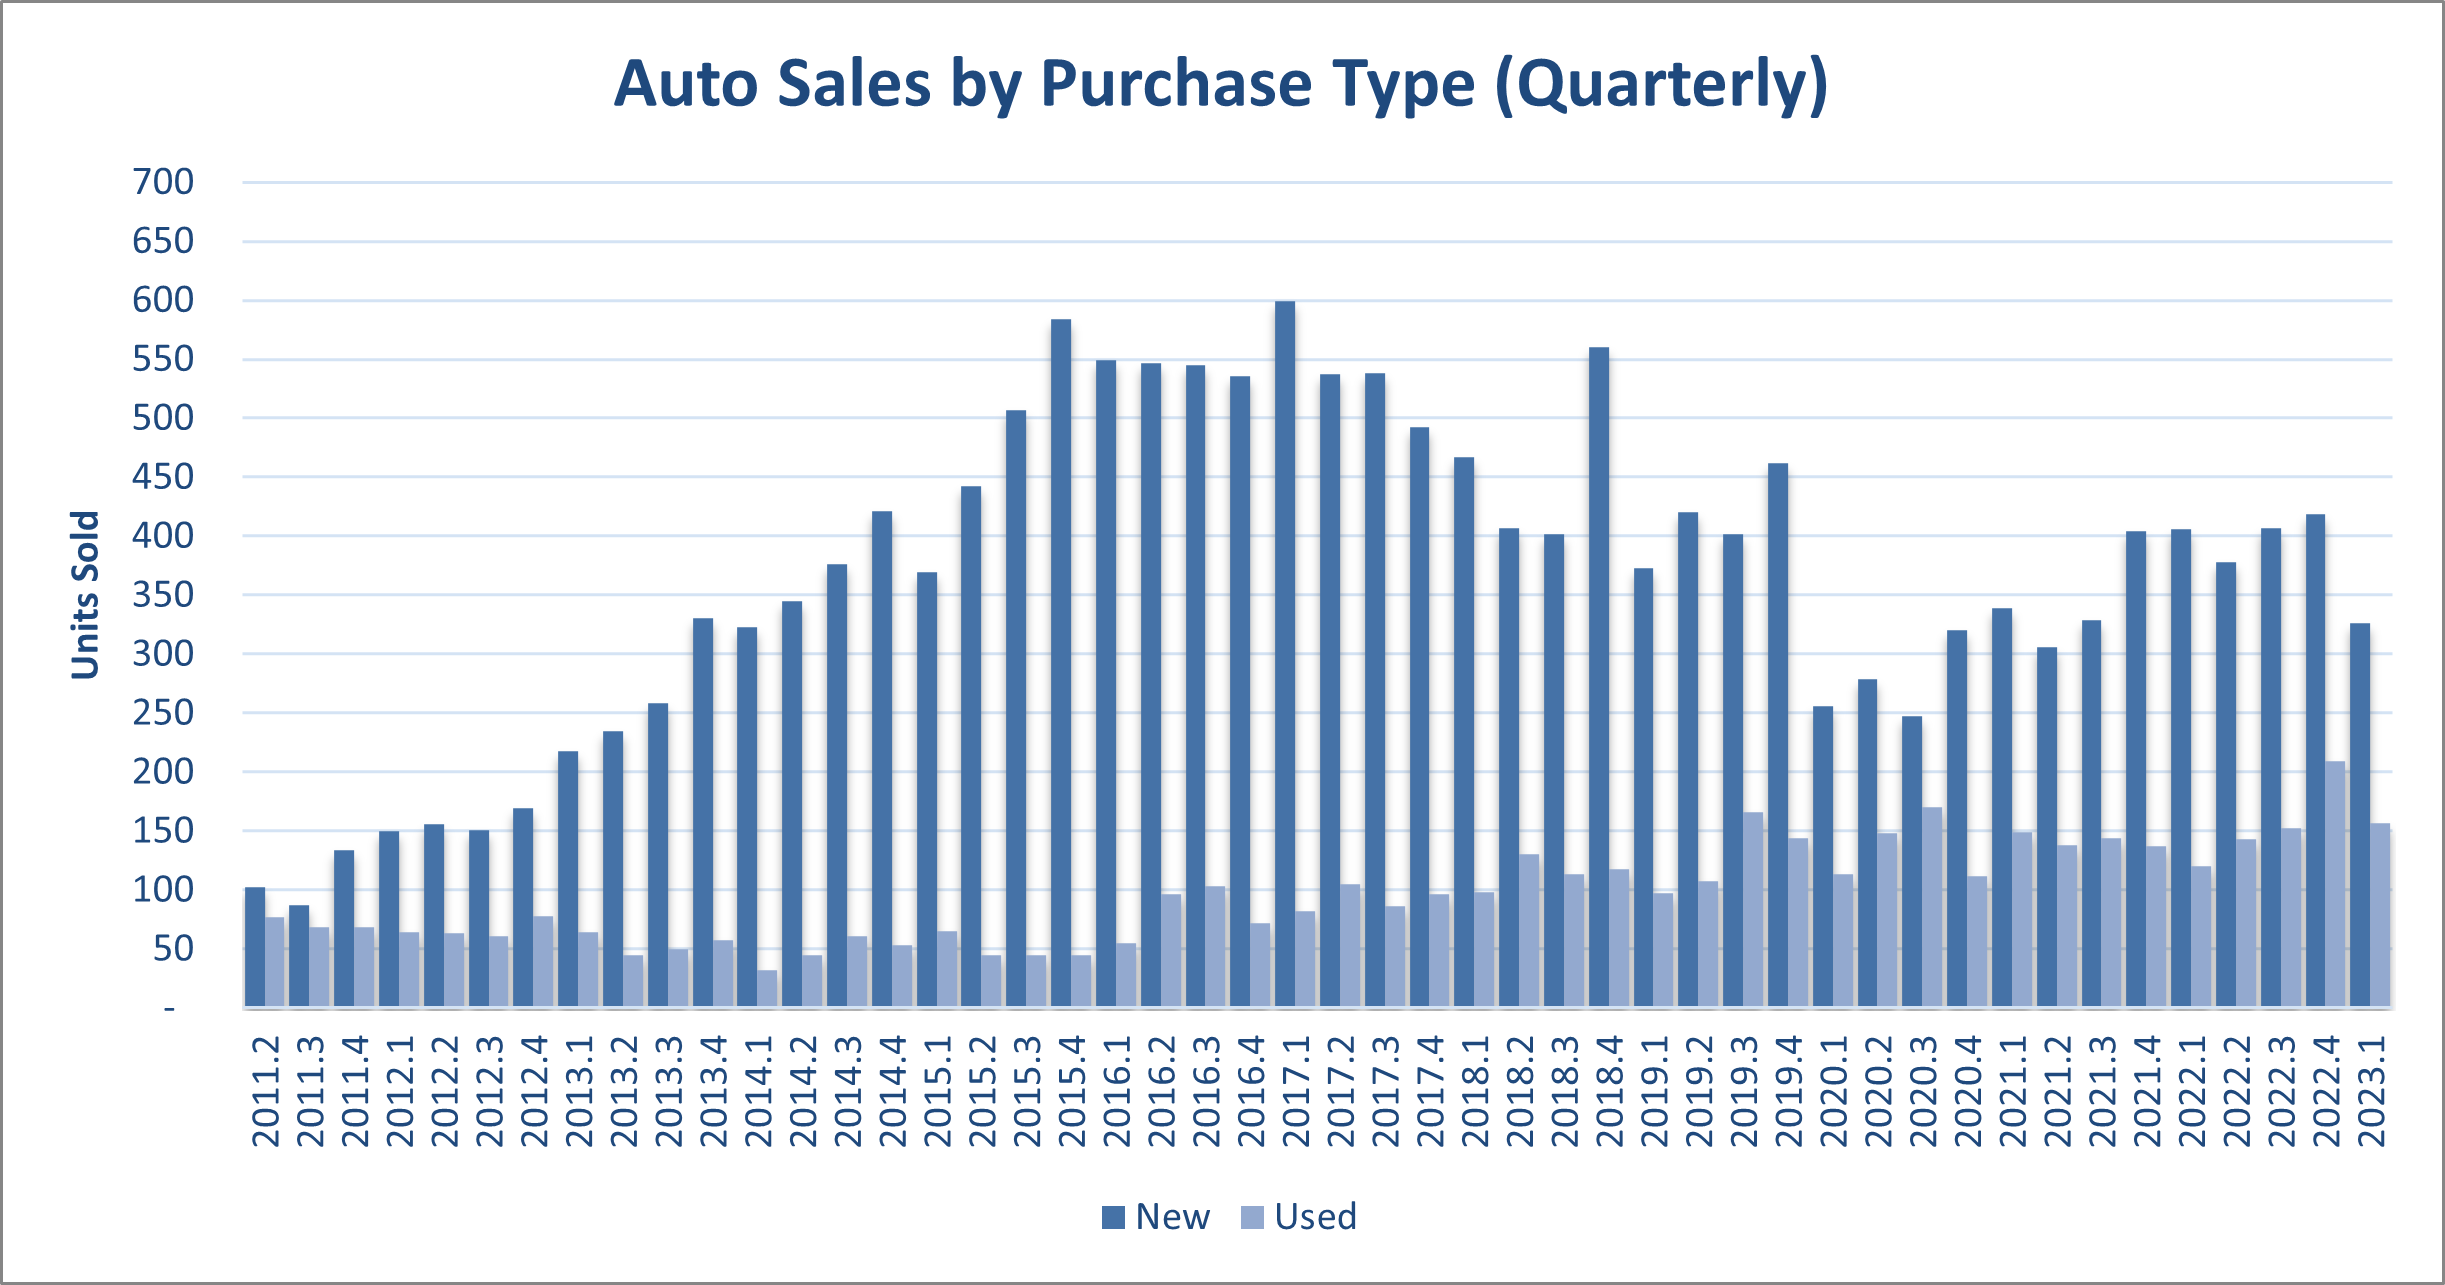
Economic Indicator (EI) Data as it relates to Auto Sales, quarters 1 through 4. Auto Sales Annual Reports are reflected off the 4th Quarter of their respected Year
Economic Indicator
EI Auto Sales (Annual)
Annual Auto Sales Economic Indicator
Units of Measure= $USD (Millions)
Source: Commonwealth Auto Dealer’s Association (CADA)
| Total Units Sold | % Change From Previous Year | New | Used | |
|---|---|---|---|---|
| Source: CNMI Economic Indicators / CSD | ||||
| 2023* | 483 | -78.38% | 326 | 157 |
| 2022 | 2,234 | 14.80% | 1,610 | 624 |
| 2021 | 1,946 | 18.30% | 1,378 | 568 |
| 2020 | 1,645 | -24.23% | 1,102 | 543 |
| 2019 | 2,171 | -5.40% | 1,657 | 514 |
| 2018 | 2,295 | -9.47% | 1,836 | 459 |
| 2017 | 2,535 | 1.28% | 2,166 | 369 |
| 2016 | 2,503 | 19.08% | 2,177 | 326 |
| 2015 | 2,102 | 26.93% | 1,902 | 200 |
| 2014 | 1,656 | 31.74% | 1,465 | 191 |
| 2013 | 1,257 | 40.92% | 1,041 | 216 |
| 2012 | 892 | 22.53% | 626 | 266 |
| 2011 | 728 | -17.37% | 454 | 274 |
| 2010 | 881 | 3.77% | 602 | 279 |
| 2009 | 849 | -12.11% | 469 | 380 |
| 2008 | 966 | -12.26% | 595 | 371 |
| 2007 | 1,101 | -18.57% | 632 | 469 |
EI Auto Sales (Quarterly)
Quarterly Auto Sales Economic Indicator
Units of Measure= $USD (Millions)
Source: Commonwealth Auto Dealer’s Association (CADA)
| Total Units Sold | % Change From Previous Quarter | New | Used | |
|---|---|---|---|---|
| Source: CNMI Economic Indicators / CSD | ||||
| 2023.1 | 483 | -23.09% | 326 | 157 |
| 2022.4 | 628 | 12.34% | 419 | 209 |
| 2022.3 | 559 | 7.29% | 407 | 152 |
| 2022.2 | 521 | -0.95% | 378 | 143 |
| 2022.1 | 526 | -2.77% | 406 | 120 |
| 2021.4 | 541 | 14.38% | 404 | 137 |
| 2021.3 | 473 | 6.53% | 329 | 144 |
| 2021.2 | 444 | -9.02% | 306 | 138 |
| 2021.1 | 488 | 12.96% | 339 | 149 |
| 2020.4 | 432 | 3.60% | 320 | 112 |
| 2020.3 | 417 | -2.34% | 247 | 170 |
| 2020.2 | 427 | 15.72% | 279 | 148 |
| 2020.1 | 369 | -39.11% | 256 | 113 |
| 2019.4 | 606 | 6.69% | 462 | 144 |
| 2019.3 | 568 | 7.78% | 402 | 166 |
| 2019.2 | 527 | 12.13% | 420 | 107 |
| 2019.1 | 470 | -30.68% | 373 | 97 |
| 2018.4 | 678 | 31.65% | 560 | 118 |
| 2018.3 | 515 | -4.10% | 402 | 113 |
| 2018.2 | 537 | -4.96% | 407 | 130 |
| 2018.1 | 565 | -3.91% | 467 | 98 |
| 2017.4 | 588 | -5.77% | 492 | 96 |
| 2017.3 | 624 | -2.80% | 538 | 86 |
| 2017.2 | 642 | -5.73% | 537 | 105 |
| 2017.1 | 681 | 12.01% | 599 | 82 |
| 2016.4 | 608 | -6.17% | 536 | 72 |
| 2016.3 | 648 | 0.78% | 545 | 103 |
| 2016.2 | 643 | 6.46% | 547 | 96 |
| 2016.1 | 604 | -3.97% | 549 | 55 |
| 2015.4 | 629 | 13.95% | 584 | 45 |
| 2015.3 | 552 | 13.35% | 507 | 45 |
| 2015.2 | 487 | 12.21% | 442 | 45 |
| 2015.1 | 434 | -8.44% | 369 | 65 |
| 2014.4 | 474 | 8.47% | 421 | 53 |
| 2014.3 | 437 | 12.05% | 376 | 61 |
| 2014.2 | 390 | 9.86% | 345 | 45 |
| 2014.1 | 355 | -8.27% | 323 | 32 |
| 2013.4 | 387 | 25.65% | 330 | 57 |
| 2013.3 | 308 | 10.00% | 258 | 50 |
| 2013.2 | 280 | -0.71% | 235 | 45 |
| 2013.1 | 282 | 14.17% | 218 | 64 |
| 2012.4 | 247 | 16.51% | 169 | 78 |
| 2012.3 | 212 | -3.20% | 151 | 61 |
| 2012.2 | 219 | 2.34% | 156 | 63 |
| 2012.1 | 214 | 5.94% | 150 | 64 |
| 2011.4 | 202 | 30.32% | 134 | 68 |
| 2011.3 | 155 | -13.41% | 87 | 68 |
| 2011.2 | 179 | -6.77% | 102 | 77 |
| 2011.1 | 192 | -1.03% | 131 | 61 |
| 2010.4 | 194 | -17.80% | 139 | 55 |
| 2010.3 | 236 | 21.03% | 153 | 83 |
| 2010.2 | 195 | -23.83% | 128 | 67 |
| 2010.1 | 256 | 23.08% | 182 | 74 |
| 2009.4 | 208 | -11.49% | 134 | 74 |
| 2009.3 | 235 | 15.76% | 139 | 96 |
| 2009.2 | 203 | 0.00% | 101 | 102 |
| 2009.1 | 203 | 7.98% | 95 | 108 |
| 2008.4 | 188 | -25.40% | 95 | 93 |
| 2008.3 | 252 | 11.50% | 155 | 97 |
| 2008.2 | 226 | -24.67% | 155 | 71 |
| 2008.1 | 300 | 8.30% | 190 | 110 |
| 2007.4 | 277 | -3.82% | 137 | 140 |
| 2007.3 | 288 | 10.34% | 157 | 131 |
| 2007.2 | 261 | -5.09% | 157 | 104 |
| 2007.1 | 275 | 8.70% | 181 | 94 |
Economic Indicator
To download, right click on the chart and select “Save Image As”…


