DescriptionTable DataChart and Figure Data
Ch.1 POPULATION
Ch.1 POPULATION
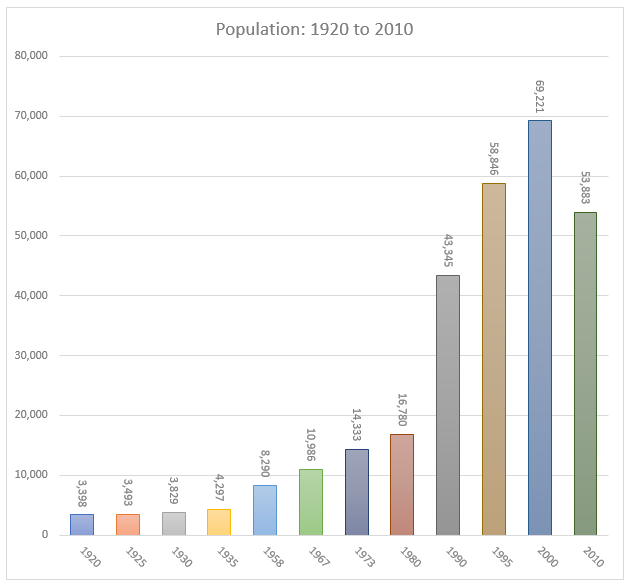
SY 2017 Table1.1 Population by Island, CNMI: 1920 to 2010 (Number of Persons)
Statistical Yearbook 2017 CNMI CSD
Note: 1920 to 1935 for Natives only
| Saipan | Rota | Tinian | N. Island | |
|---|---|---|---|---|
| Source: Census reports for respective years Note: 1920 to 1935 for Natives only |
||||
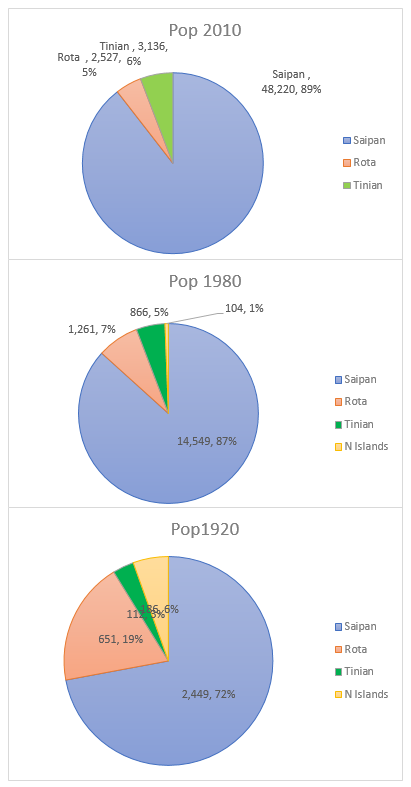
| 2010 | 48220 | 2527 | 3136 | 0 |
| 2000 | 62392 | 3283 | 3540 | 6 |
| 1995 | 52698 | 3509 | 2631 | 8 |
| 1990 | 38896 | 2295 | 2118 | 36 |
| 1980 | 14549 | 1261 | 866 | 104 |
| 1973 | 12382 | 1104 | 714 | 133 |
| 1967 | 9035 | 1078 | 610 | 263 |
| 1958 | 6654 | 969 | 405 | 262 |
| 1935 | 3194 | 788 | 24 | 291 |
| 1930 | 2915 | 644 | 43 | 227 |
| 1925 | 2639 | 487 | 180 | 187 |
| 1920 | 2449 | 651 | 112 | 186 |
SY 2017 Table1.1 Population by Island, CNMI: 1920 to 2010 (Percent)
Statistical Yearbook 2017 CNMI CSD
Note: 1920 to 1935 for Natives only
Note: “0.0” means less than 1 percent
| Saipan | Rota | Tinian | N. Island | |
|---|---|---|---|---|
| Source: Census reports for respective years Note: 1920 to 1935 for Natives only Note: “0.0” means less than 1 percent |
||||
| 2010 | 89.5% | 4.7% | 5.8% | 0% |
| 2000 | 90.1% | 4.7% | 5.1% | 0% |
| 1995 | 89.6% | 6.0% | 4.5% | 0% |
| 1990 | 89.7% | 5.3% | 4.9% | 0.1% |
| 1980 | 86.7% | 7.5% | 5.2% | 0.6% |
| 1973 | 86.4% | 7.7% | 5.0% | 0.9% |
| 1967 | 82.2% | 9.8% | 5.6% | 2.4% |
| 1958 | 80.3% | 11.7% | 4.9% | 3.2% |
| 1935 | 74.3% | 18.3% | 0.6% | 6.8% |
| 1930 | 76.1% | 16.8% | 1.1% | 5.9% |
| 1925 | 75.6% | 13.9% | 5.2% | 5.4% |
| 1920 | 72.1% | 19.2% | 3.3% | 5.5% |
To download HD image, right click on image and select “Save Image As”…