LFP HOUSING CHARACTERISTICS BY YEAR BUILT
CNMI Total
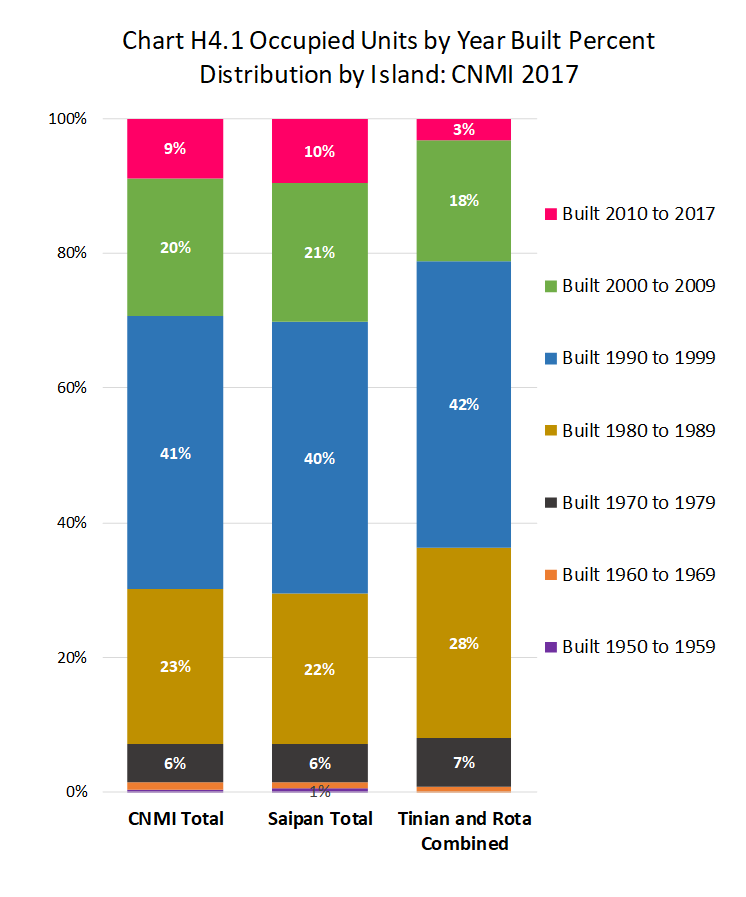
Majority of occupied units in the CNMI in 2017 were built in the 80s, 90s and 00s. Units built in the 1990s was 40.5% of all occupied housing units; units built in the 1980s was 23.0%; units built in the 2000s was 20.4%; units built in the 2010s was 8.9%; units built in the 1970s was 5.7%; while units build prior to 1970 was only 1.5%.
By Island
Relatively less units were built in Tinian and Rota (3%) than in Saipan (9.5%) in the 2010s. Please see chart H4.1 and Table H4.1 below for detail. (Note that Tinian and Rota were combined, and Saipan districts were not treated separately, under this topic because of low number of cases. The response rate in the survey for this variable (year built) was only 42%.) See Chart H4.1 and Table H4.1 for detail.
Housing Characteristics
LFS 2017 Table H4.1
Labor Force Participation Measures
Table H4.1 Occupied Housing Units by Year Built, by Island, and by District: CNMI, 2017 4th Qtr.
| Saipan District 1 |
Saipan District 2 |
Saipan District 3 |
Saipan District 4 |
Saipan District 5 |
Tinian District 6 |
Rota District 7 |
|
|---|---|---|---|---|---|---|---|
| Source: Labor Force Survey CNMI, 2017 4th Qtr. | |||||||
| Built 2010 to 2017 | 8 | 1 | 8 | 5 | 7 | 4 | |
| Built 2000 to 2009 | 17 | 4 | 13 | 10 | 20 | 12 | 14 |
| Built 1990 to 1999 | 41 | 4 | 29 | 38 | 23 | 37 | 28 |
| Built 1980 to 1989 | 35 | 4 | 9 | 11 | 9 | 25 | 16 |
| Built 1970 to 1979 | 4 | 3 | 2 | 5 | 4 | 3 | 8 |
| Built 1960 to 1969 | 2 | 1 | 1 | ||||
| Built 1950 to 1959 | 1 | 1 | |||||
| (blank) | 115 | 87 | 209 | 29 | 50 | 99 | 66 |
Housing Characteristics
To download chart, right click on the chart and select “Save Image As”…


