LFP HOUSING CHARACTERISTICS BY TRASH COLLECTION AND MONTHLY TRASH COLLECTION BILL
BY TRASH COLLECTION
CNMI Total
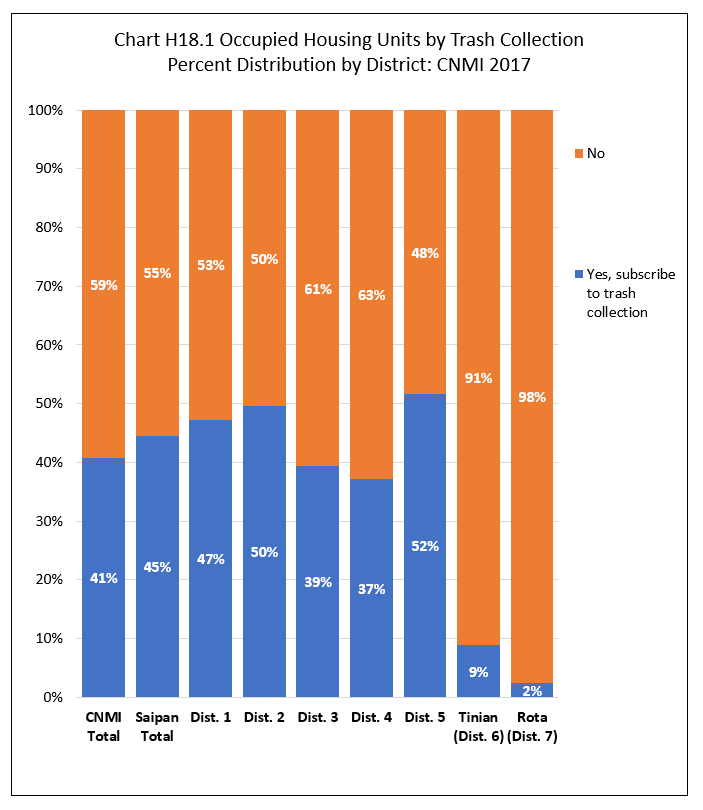
Units that subscribed to trash collection service was 40.6% of all occupied housing units in the CNMI in 2017 while units not subscribing was 59.4%.
By Island
The percentage of occupied units that subscribed to trash collection service was higher in Saipan (44.5%), while lower in Tinian (8.9%) and Rota (1.6%). (Note that Tinian and Rota do not have companies that provide trach collection service like in Saipan. Trash collection service in these two islands are likely part of privately arranged landscaping/trach collection services.)
By Saipan Districts
Within Saipan, the percentage of all occupied units that subscribed to trash collection service was highest in Districts 5 (51.7%) and was lowest in District 4 (37.7%). See Chart H18.1 and Table H18.1 for detail.
BY MONTHLY TRASH COLLECTION BILL
CNMI Total
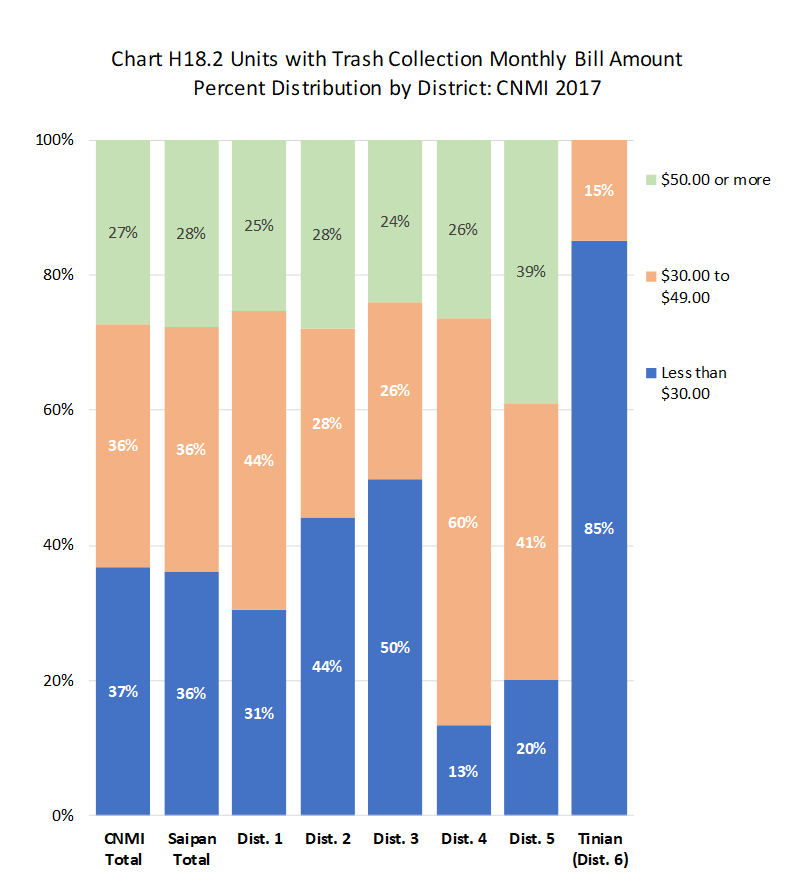
The monthly trash bill median amount was $25.00 while the mean amount was $25.06 for all units that subscribed to trash collection service, in the CNMI in 2017. Units with a monthly bill less than $30.00 was 36.9%; units that paid between $30 and $49 was 35.8%; while units that paid $50 or more was 27.9%.
By Island
In Saipan, the monthly trash bill median amount was $25.00 while the mean amount was $25.52 for all units that subscribed to a trash collection service. Units with a monthly bill less than $30.00 was 36.2%; units that paid between $30 and $49 was also 36.1%; while units that paid $50 or more was 27.7%. Almost all units that subscribed to trash collection service were in Saipan (99%), hence, Saipan’s percent distribution was the same as the whole CNMI’s.
In Tinian, the monthly trash bill median amount was $5.00 while the mean amount was $13.40 for all units that subscribed to a trash collection service. Units with a monthly bill less than $30.00 was 85.0% while units that paid between $30 and $49 was 15.0%.
In Rota, there was only few units that reported paying for a trash collection service and not enough cases to derive reliable monthly bill amount estimate. See Chart H18.2 and Table H18.2 for detail.
By Saipan Districts
Within Saipan, no difference in the monthly trash bill median amount, it was $25 in all districts. The mean amount ranged from a low of $21.87 in District 4 to a high of $28.68 in District 1. The percentage of units that paid less than $30 for trash collection was highest in District 3 (49.9%) and was lowest in District 4 (13.3%). The percentage of units that paid between $30 and $49 was highest in District 4 (60.3%) and was lowest in District 3 (26.2%). The percentage of units that paid $50 or more was highest in District 5 (38.9%) and was lowest in District 3 (23.9%).
Housing Characteristics
LFS 2017 Table H18.1
Labor Force Participation Measures
Table H18.1 Occupied Housing Units by Trash Collection, by Island, and by District: CNMI, 2017 4th Qtr.
| Saiapn District 1 |
Saiapn District 2 |
Saiapn District 3 |
Saiapn District 4 |
Saiapn District 5 |
Tinian District 6 |
Rota District 7 |
||
|---|---|---|---|---|---|---|---|---|
| Source: Labor Force Survey CNMI, 2017 4th Qtr. | ||||||||
| Trash Collection | Yes, subscribe to trash collection | 2,047 | 1,018 | 2,175 | 416 | 1,043 | 80 | 18 |
| Trash Collection | No | 2,285 | 1,033 | 3,347 | 705 | 976 | 819 | 746 |
| Percent within | Yes subscribe to trash collection | 47.3% | 49.6% | 39.4% | 37.1% | 51.7% | 8.9% | 2.4% |
| Percent within | No | 52.7% | 50.4% | 60.6% | 62.9% | 48.3% | 91.1% | 97.6% |
| Percent by | Yes subscribe to trash collection | 30.1% | 15.0% | 32.0% | 6.1% | 15.3% | 1.2% | 0.3% |
| Percent by | No | 23.1% | 10.4% | 33.8% | 7.1% | 9.8% | 8.3% | 7.5% |
LFS 2017 Table H18.2
Labor Force Participation Measures 2017
Table H18.2 Occupied Housing Units by Monthly Trash Bill, by Island, and by District: CNMI, 2017 4th Qtr.
Note: Individual column items may not add to CNMI Total because Rota figures are not shown.
| Saipan District 1 |
Saipan District 2 |
Saipan District 3 |
Saipan District 4 |
Saipan District 5 |
Tinian District 6 |
||
|---|---|---|---|---|---|---|---|
| Source: Labor Force Survey CNMI, 2017 4th Qtr. | |||||||
| Monthly Trash Bill | Less than $30.00 | 512 | 407 | 974 | 46 | 205 | 65 |
| Monthly Trash Bill | $30.00 to $49.00 | 739 | 257 | 512 | 210 | 420 | 11 |
| Monthly Trash Bill | $50.00 or more | 424 | 257 | 467 | 92 | 399 | – |
| Median | $25.00 | $25.00 | $25.00 | $25.00 | $25.00 | $5.00 | |
| Mean | $28.68 | $24.25 | $21.87 | $28.14 | $26.02 | $13.40 | |
| Percent within | Less than $30.00 | 30.6% | 44.2% | 49.9% | 13.3% | 20.0% | 85.0% |
| Percent within | $30.00 to $49.00 | 44.1% | 27.9% | 26.2% | 60.3% | 41.1% | 15.0% |
| Percent within | $50.00 or more | 25.3% | 27.9% | 23.9% | 26.4% | 38.9% | 0.0% |
| Percent by | Less than $30.00 | 23.1% | 18.4% | 44.0% | 2.1% | 9.3% | 2.9% |
| Percent by | $30.00 to $49.00 | 34.4% | 11.9% | 23.8% | 9.8% | 19.6% | 0.5% |
| Percent by | $50.00 or more | 25.9% | 15.7% | 28.5% | 5.6% | 24.3% | 0.0% |
Housing Characteristics
To download chart, right click on the chart and select “Save Image As”…