DescriptionTable DataChart and Figure Data
Ch.12 AGRICULTURE and FISHING
Ch.12 AGRICULTURE and FISHING
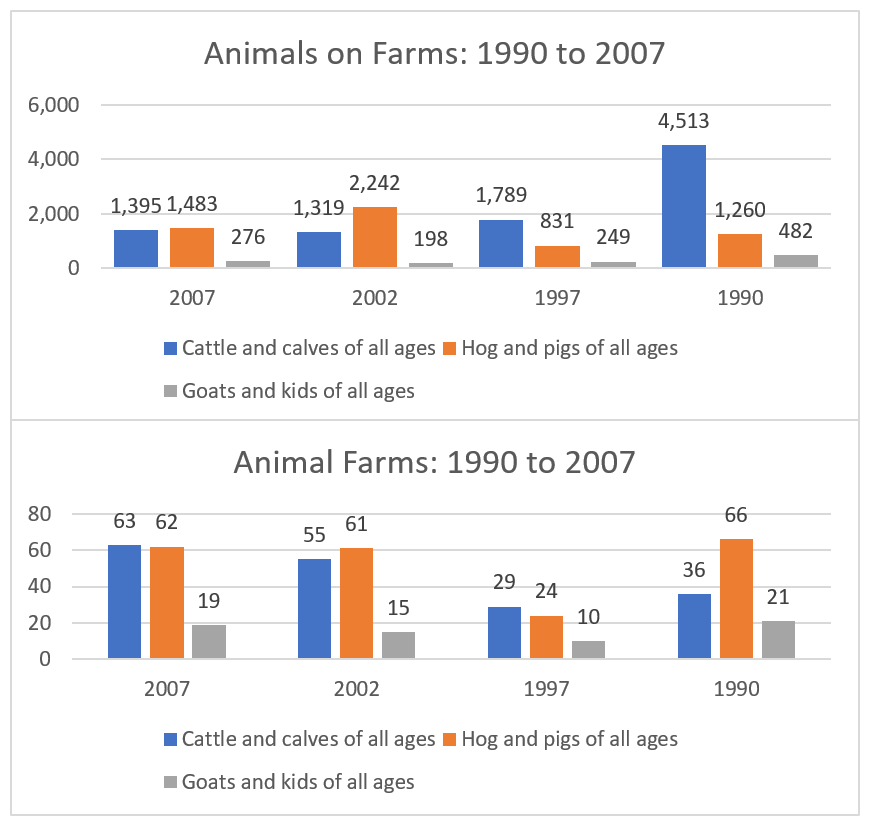
SY 2017 Table 12.2 Number of Livestock Farms, CNMI: 1990 to 2007
Statistical Yearbook 2017 CNMI CSD
Note: “D” means data withheld to avoid disclosing figures for individual establishments; data are included in higher level totals
| Farms 2007 |
Animals 2007 |
Farms 2002 |
Animals 2002 |
Farms 1997 |
Animals 1997 |
Farms 1990 |
Animals 1990 |
|
|---|---|---|---|---|---|---|---|---|
| Source: 1997 Census of Agriculture, AC97-A-56, Table 11 and 2007 Agriculture Census Report | ||||||||
| Cattle and calves of all ages | 63 | 1,395 | 55 | 1,319 | 29 | 1,789 | 36 | 4,513 |
| Milk cows | 7 | 83 | 3 | 14 | 6 | 80 | ||
| Other cattle and calves | 62 | 1,312 | 55 | 1,319 | 28 | 1,775 | 33 | 4,433 |
| Hog and pigs of all ages | 62 | 1,483 | 61 | 2,242 | 24 | 831 | 66 | 1,260 |
| Goats and kids of all ages | 19 | 276 | 15 | 198 | 10 | 249 | 21 | 482 |
| Horses, mules and colts of all ages | 1 | 2 | 1 | D | 2 | D | ||
| Other livestock | 4 | 32 | 4 | 32 |
SY 2017 Table 12.3 Number of Livestocks Sold , CNMI: 1990 to 2007
Statistical Yearbook 2017 CNMI CSD
Note: “D” means data withheld to avoid disclosing figures for individual establishments; data are included in higher level totals
| Farms 2007 |
Animals 2007 |
Farms 2002 |
Animals 2002 |
Farms 1997 |
Animals 1997 |
Farms 1990 |
Animals 1990 |
|
|---|---|---|---|---|---|---|---|---|
| Source: 1997 Census of Agriculture, AC97-A-56, Table 11 and 2007 Agriculture Census Report | ||||||||
| Cattle and calves of all ages | 59 | 275 | 39 | 296 | 17 | 456 | 14 | 702 |
| Milk cows | 4 | 13 | … | D | … | 22 | ||
| Other cattle and calves | 57 | 262 | 39 | 296 | 17 | 447 | … | 680 |
| Hog and pigs of all ages | 50 | 675 | 42 | 3,039 | 22 | 635 | 28 | 360 |
| Goats and kids of all ages | 8 | 43 | 3 | 92 | 3 | 27 | 3 | 8 |
| Horses, mules and colts of all ages | 1 | 1 | 1 | D | 1 | D | ||
| Other livestock | 1 | D | 1 | D |
Ch.12 AGRICULTURE and FISHING
To download, right click the chart and select “Save Image As”…