DescriptionTable DataChart and Figure Data
Ch.22 HISTORICAL
Ch.22 HISTORICAL
SY 2017 Table 22.23 Population Density by Island: 1920 to 1980
Statistical Yearbook 2017 CNMI CSD
| Saipan | Rota | Tinian | N. Islands | |
|---|---|---|---|---|
| Source: Census Reports for respective years: 1920 to 1935 for Natives only | ||||
| 1980 | 14,549 | 1,261 | 866 | 104 |
| 1973 | 12,382 | 1,104 | 714 | 133 |
| 1967 | 9,035 | 1,078 | 610 | 263 |
| 1958 | 6,654 | 969 | 405 | 262 |
| 1935 | 3,194 | 788 | 24 | 291 |
| 1930 | 2,915 | 644 | 43 | 227 |
| 1925 | 2,639 | 487 | 180 | 187 |
| 1920 | 2,449 | 651 | 112 | 186 |
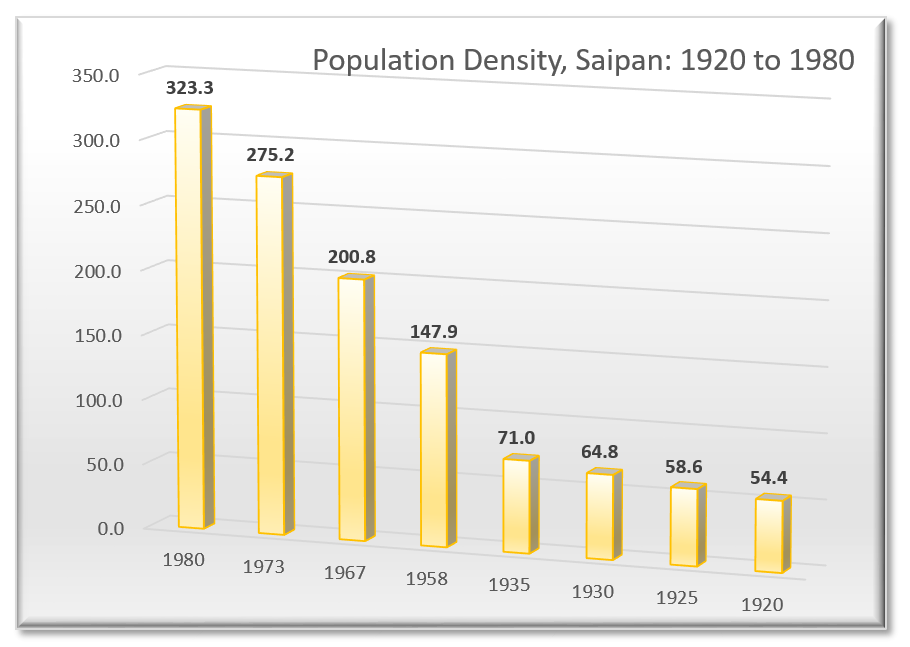
SY 2017 Table 22.23 Population Density by Island: 1920 to 1980 (Per Square Mile)
Statistical Yearbook 2017 CNMI CSD
| Per Square Mile | Saipan | Rota | Tinian | N. Is |
|---|---|---|---|---|
| Source: Census Reports for respective years: 1920 to 1935 for Natives only | ||||
| 1980 | 323.3 | 39.4 | 22.2 | 1.5 |
| 1973 | 275.2 | 34.5 | 18.3 | 2.0 |
| 1967 | 200.8 | 33.7 | 15.6 | 3.9 |
| 1958 | 147.9 | 30.3 | 10.4 | 3.9 |
| 1935 | 71.0 | 24.6 | 0.6 | 4.3 |
| 1930 | 64.8 | 20.1 | 1.1 | 3.3 |
| 1925 | 58.6 | 15.2 | 4.6 | 2.8 |
| 1920 | 54.4 | 20.3 | 2.9 | 2.7 |
SY 2017 Table 22.24 Population Density by Island: 1920 to 1980
Statistical Yearbook 2017 CNMI CSD
| Change from previous census | Saipan | Rota | Tinian | N. Is |
|---|---|---|---|---|
| Source: Census Reports for respective years: 1920 to 1935 for Natives only | ||||
| 1980 | 17.5% | 14.2% | 21.3% | -21.8% |
| 1973 | 37.0% | 2.4% | 17.0% | -49.4% |
| 1967 | 35.8% | 11.2% | 50.6% | 0.4% |
| 1958 | 108.3% | 23.0% | 1587.5% | -10.0% |
| 1935 | 9.6% | 22.4% | -44.2% | 28.2% |
| 1930 | 10.5% | 32.2% | -76.1% | 21.4% |
| 1925 | 7.8% | -25.2% | 60.7% | 0.5% |
SY 2017 Table 22.24 Population Density by Island: 1920 to 1980
Statistical Yearbook 2017 CNMI CSD
| Annual Change (Linear) | Saipan | Rota | Tinian | N. Is |
|---|---|---|---|---|
| Source: Census Reports for respective years: 1920 to 1935 for Natives only | ||||
| 1980 | 2.5% | 2.0% | 3.0% | -3.1% |
| 1973 | 6.2% | 0.4% | 2.8% | -8.2% |
| 1967 | 4.0% | 1.2% | 5.6% | 0.0% |
| 1958 | 4.7% | 1.0% | 69.0% | -0.4% |
| 1935 | 1.9% | 4.5% | -8.8% | 5.6% |
| 1930 | 2.1% | 6.4% | -15.2% | 4.3% |
| 1925 | 1.6% | -5.0% | 12.1% | 0.1% |
Ch.22 HISTORICAL
To download, right click on the chart and select “Save Image As”…