DescriptionTable DataChart and Figure Data
CBHS 2016
CBHS 2016
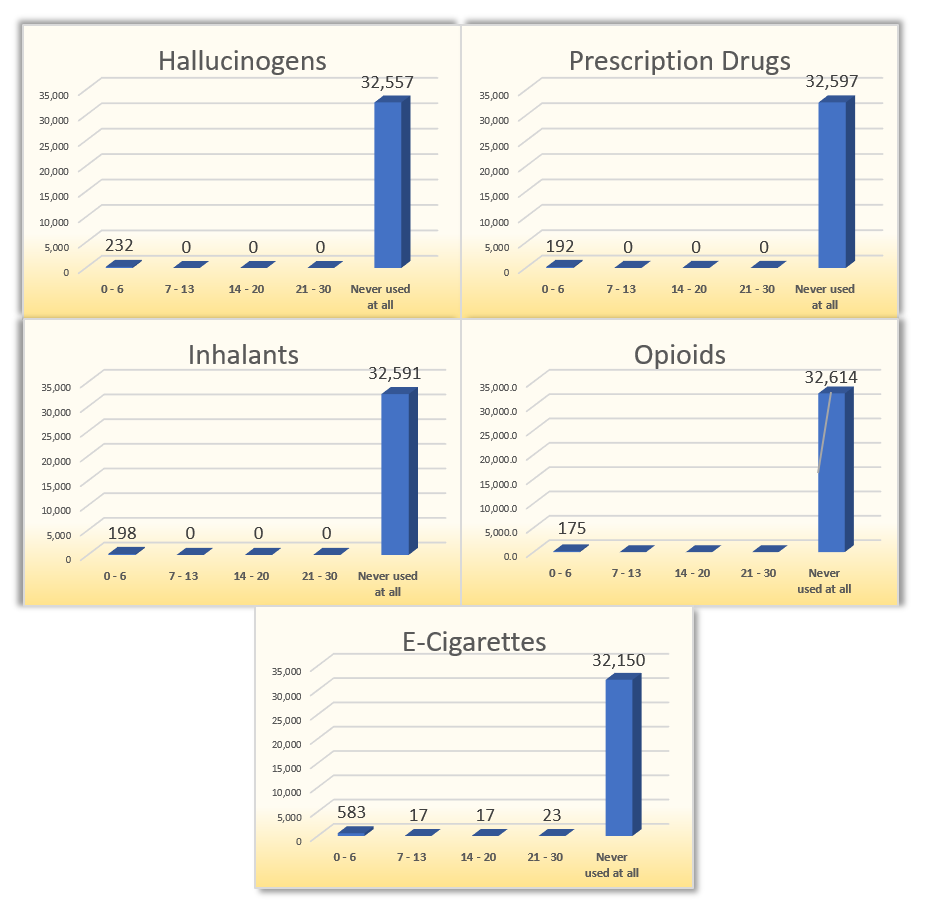
CBHS 2016 Table 20.6 Age by Hallucinogens, Inhalants, Prescription drugs, Opioids, and Ecigarettes, CNMI: 2016
CNMI Behavioral Health Survey 2016
| 0-14 | 15-29 | 30-44 | 45-59 | 60-74 | 75+ | Median | ||
|---|---|---|---|---|---|---|---|---|
| Source: 2016 CNMI Health Survey (CBHS and NCDS) | ||||||||
| Hallucinogens | 0 – 6 | – | 22 | 51 | 108 | 51 | – | 50.9 |
| Hallucinogens | 7 – 13 | – | – | – | – | – | – | 0 |
| Hallucinogens | 14 – 20 | – | – | – | – | – | – | 0 |
| Hallucinogens | 21 – 30 | – | – | – | – | – | – | 0 |
| Hallucinogens | Never used at all | 34 | 6,385 | 8,999 | 12,353 | 4,198 | 588 | 46 |
| Inhalants | 0 – 6 | – | 22 | 17 | 91 | 68 | – | 54.9 |
| Inhalants | 7 – 13 | – | – | – | – | – | – | 0 |
| Inhalants | 14 – 20 | – | – | – | – | – | – | 0 |
| Inhalants | 21 – 30 | – | – | – | – | – | – | 0 |
| Inhalants | Never used at all | 34 | 6,385 | 9,033 | 12,370 | 4,181 | 588 | 46 |
| Prescription drugs | 0 – 6 | – | 39 | 17 | 85 | 51 | – | 52 |
| Prescription drugs | 7 – 13 | – | – | – | – | – | – | 0 |
| Prescription drugs | 14 – 20 | – | – | – | – | – | – | 0 |
| Prescription drugs | 21 – 30 | – | – | – | – | – | – | 0 |
| Prescription drugs | Never used at all | 34 | 6,368 | 9,033 | 12,376 | 4,198 | 588 | 46 |
| Opioids | 0 – 6 | – | 39 | – | 85 | 51 | – | 53.5 |
| Opioids | 7 – 13 | – | – | – | – | – | – | 0 |
| Opioids | 14 – 20 | – | – | – | – | – | – | 0 |
| Opioids | 21 – 30 | – | – | – | – | – | – | 0 |
| Opioids | Never used at all | 34 | 6,368 | 9,050 | 12,376 | 4,198 | 588 | 46 |
| ECigarettes | 0 – 6 | – | 294 | 153 | 85 | 51 | – | 29.9 |
| ECigarettes | 7 – 13 | – | 17 | – | – | – | – | 22.5 |
| ECigarettes | 14 – 20 | – | 17 | – | – | – | – | 22.5 |
| ECigarettes | 21 – 30 | – | 23 | – | – | – | – | 22.5 |
| ECigarettes | Never used at all | 34 | 6,057 | 8,897 | 12,376 | 4,198 | 588 | 46.3 |
CBHS 2016
To download, right click on the chart and select “Save Image As”…


