DescriptionTable DataChart and Figure Data
CBHS 2016
CBHS 2016
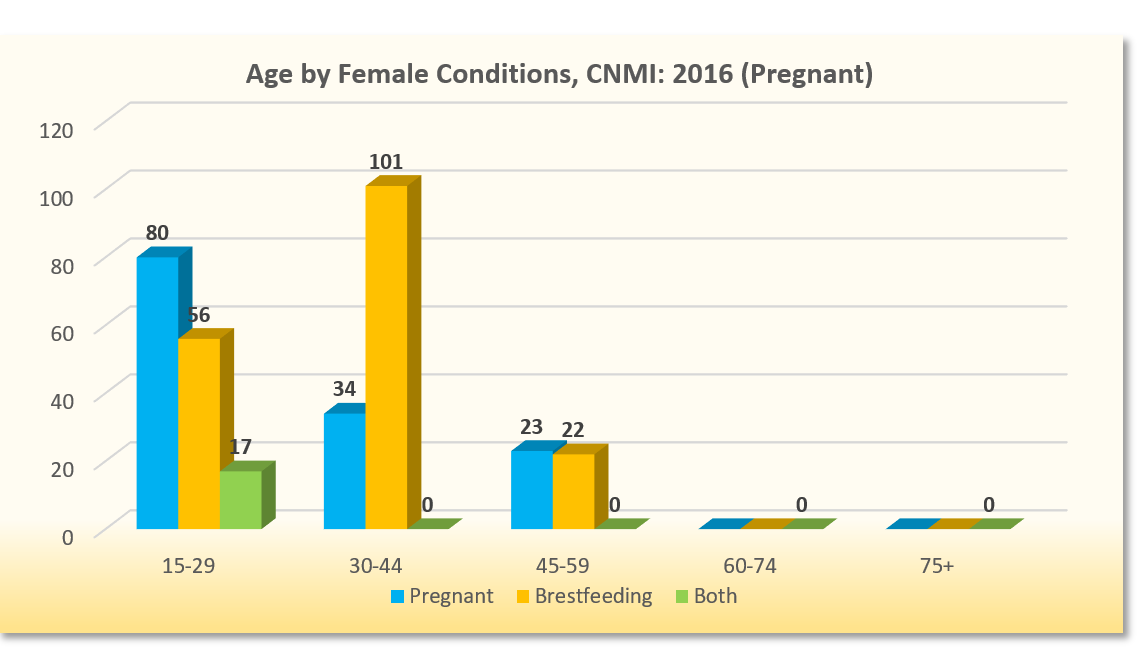
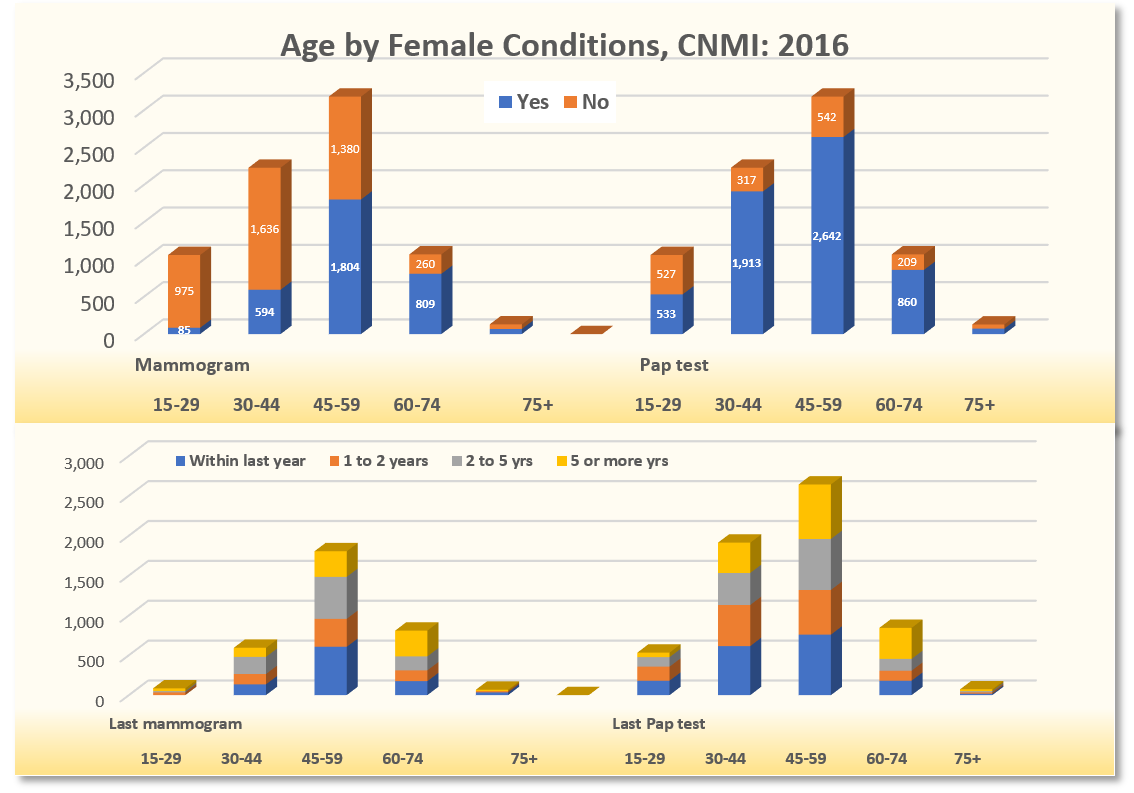
CBHS 2016 Table 20.23 Age by Female Conditions, CNMI: 2016
CNMI Behavioral Health Survey 2016
| 15-29 | 30-44 | 45-59 | 60-74 | 75+ | Median | ||
|---|---|---|---|---|---|---|---|
| Source: 2016 CNMI Health Survey (CBHS and NCDS) | |||||||
| Pregnant | Pregnant | 80 | 34 | 23 | – | – | 27.8 |
| Pregnant | Brestfeeding | 56 | 101 | 22 | – | – | 35 |
| Pregnant | Both | 17 | – | – | – | – | 22.5 |
| Pregnant | Neither | 907 | 2,094 | 3,139 | 1,069 | 130 | 48.2 |
| Mammogram | Yes | 85 | 594 | 1,804 | 809 | 68 | 53.3 |
| Mammogram | No | 975 | 1,636 | 1,380 | 260 | 62 | 40.8 |
| Last mammogram | Within last year | – | 135 | 606 | 175 | 34 | 53.4 |
| Last mammogram | 1 to 2 years | 34 | 130 | 351 | 136 | 17 | 52.3 |
| Last mammogram | 2 to 5 yrs | 17 | 215 | 526 | 175 | – | 51.7 |
| Last mammogram | 5 or more yrs | 34 | 114 | 321 | 323 | 17 | 57 |
| Pap test | Yes | 533 | 1,913 | 2,642 | 860 | 73 | 48.2 |
| Pap test | No | 527 | 317 | 542 | 209 | 56 | 44.1 |
| Last Pap test | Within last year | 181 | 615 | 759 | 181 | 17 | 46.6 |
| Last Pap test | 1 to 2 years | 176 | 515 | 560 | 125 | 17 | 45.1 |
| Last Pap test | 2 to 5 yrs | 119 | 402 | 639 | 148 | 17 | 48.3 |
| Last Pap test | 5 or more yrs | 57 | 380 | 684 | 390 | 22 | 52.2 |
| Last Pap test | Never | – | – | – | 17 | – | 67.5 |
CBHS 2016
To download, right click on the chart and select “Save Image As”…


