DescriptionTable DataChart and Figure Data
Ch.7 ELECTION
Ch.7 ELECTION
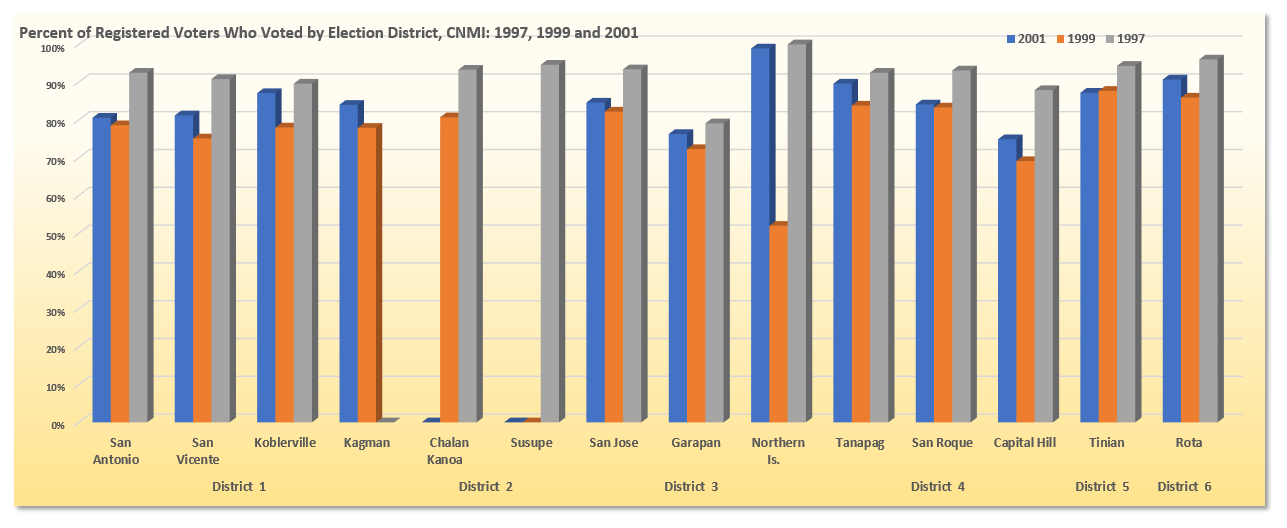
SY 2017 Table 7.3 Percent of Registered Voters Who Voted by Election District, CNMI: 1997, 1999 and 2001
Statistical Yearbook 2017 CNMI CSD
Note: Polling places indicate villages. Since 1999 some villages are combined to reflect only
Note: Districts are rearranged in 2007
| District | Village | 2001 | 1999 | 1997 | |
|---|---|---|---|---|---|
| Source: Election Commission | |||||
| All Voters | District 1 | San Antonio | 80.6% | 78.6% | 92.5% |
| All Voters | District 1 | San Vicente | 81.2% | 75.1% | 90.8% |
| All Voters | District 1 | Koblerville | 87.1% | 78.0% | 89.6% |
| All Voters | District 1 | Kagman | 84.0% | 77.9% | ? |
| All Voters | District 2 | Chalan Kanoa | ? | 80.7% | 93.3% |
| All Voters | District 2 | Susupe | ? | ? | 94.6% |
| All Voters | District 3 | San Jose | 84.6% | 82.2% | 93.4% |
| All Voters | District 3 | Garapan | 76.3% | 72.3% | 79.1% |
| All Voters | District 3 | Northern Is. | 98.9% | 52.0% | 100.0% |
| All Voters | District 4 | Tanapag | 89.6% | 83.8% | 92.5% |
| All Voters | District 4 | San Roque | 84.1% | 83.3% | 93.1% |
| All Voters | District 4 | Capital Hill | 74.9% | 69.1% | 87.9% |
| All Voters | District 5 | Tinian | 87.2% | 87.7% | 94.3% |
| All Voters | District 6 | Rota | 90.7% | 85.9% | 96.0% |
| Male | District 1 | San Antonio | ? | 78.9% | 92.4% |
| Male | District 1 | San Vicente | ? | 74.5% | 90.2% |
| Male | District 1 | Koblerville | ? | 77.7% | 89.3% |
| Male | District 1 | Kagman | ? | 77.1% | ? |
| Male | District 2 | Chalan Kanoa | ? | 80.2% | 93.1% |
| Male | District 2 | Susupe | ? | ? | 91.9% |
| Male | District 3 | San Jose | ? | 81.4% | 93.4% |
| Male | District 3 | Garapan | ? | 69.9% | 88.8% |
| Male | District 3 | Northern Is. | ? | 38.5% | 100.0% |
| Male | District 4 | Tanapag | ? | 81.9% | 92.5% |
| Male | District 4 | San Roque | ? | 84.4% | 93.1% |
| Male | District 4 | Capital Hill | ? | 68.8% | 87.1% |
| Male | District 5 | Tinian | ? | 86.2% | 94.1% |
| Male | District 6 | Rota | ? | 85.4% | 95.9% |
| Female | District 1 | San Antonio | ? | 78.1% | 92.7% |
| Female | District 1 | San Vicente | ? | 75.8% | 91.4% |
| Female | District 1 | Koblerville | ? | 78.3% | 90.0% |
| Female | District 1 | Kagman | ? | 78.7% | ? |
| Female | District 2 | Chalan Kanoa | ? | 81.4% | 93.5% |
| Female | District 2 | Susupe | ? | ? | 98.2% |
| Female | District 3 | San Jose | ? | 83.1% | 93.4% |
| Female | District 3 | Garapan | ? | 74.8% | 92.7% |
| Female | District 3 | Northern Is. | ? | 66.7% | 100.0% |
| Female | District 4 | Tanapag | ? | 85.8% | 92.6% |
| Female | District 4 | San Roque | ? | 82.2% | 93.2% |
| Female | District 4 | Capital Hill | ? | 69.5% | 88.7% |
| Female | District 5 | Tinian | ? | 89.4% | 94.5% |
| Female | District 6 | Rota | ? | 86.6% | 96.1% |
Ch.7 ELECTION
To download, right click on the chart and select “Save Image As”…