Labor Force Participation Survey 2017 Population Characteristics
CNMI Total
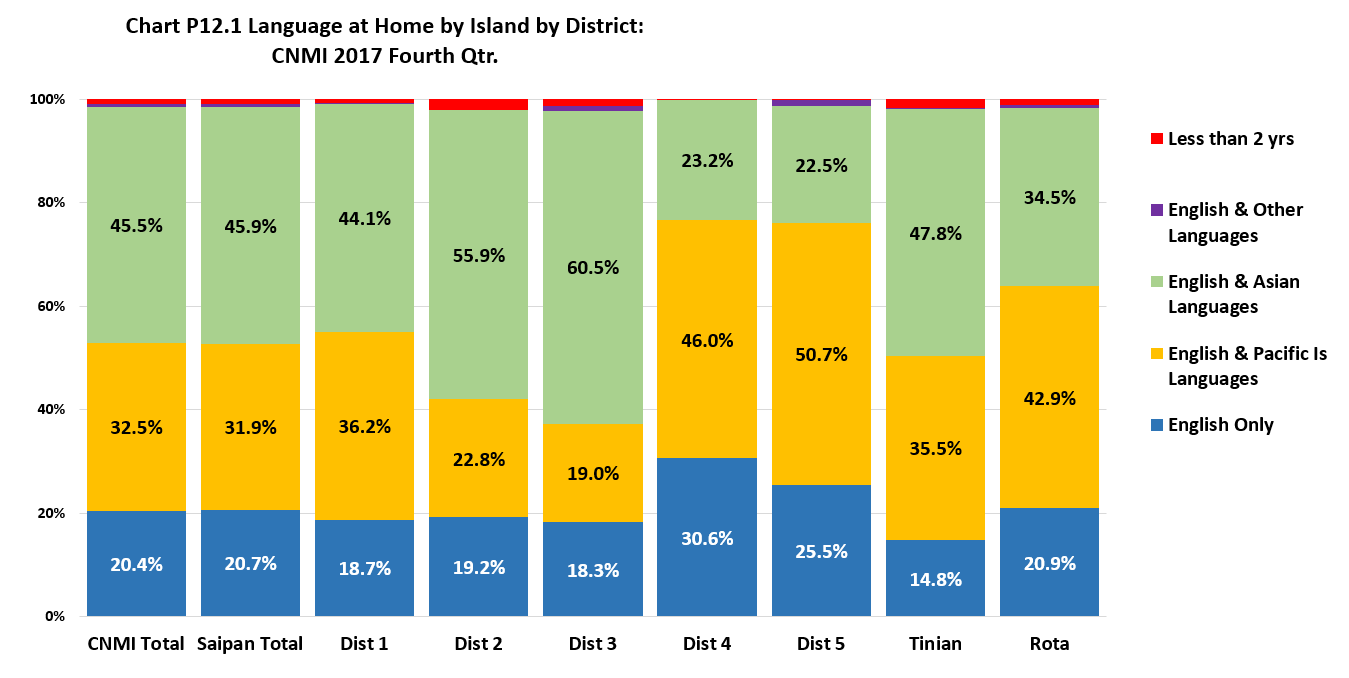
Person who spoke English only at home was 20.4% of the CNMI population in 2017. Those who spoke English and a Pacific Island language was 32.5% and those who spoke English and an Asian language was 45.5%. Persons who spoke English and Chamorro/Carolinian at home was 26.9% while those that spoke English and Filipino was 33.9%.
By Island
The percentage that spoke English only was practically the same in Saipan and Rota (20.7% and 20.9%, respectively) and lower in Tinian (14.8%). The percentage that spoke English and Chamorro/Carolinian was higher in Rota (42.9%) than in Tinian (35.5%) and in Saipan (25.8%). The percentage that spoke English and Filipino was higher in Tinian (36.9%) than in Saipan (34.0%) and in Rota (26.5%).
By Saipan Districts
The percentage that spoke English only at home was highest in District 4 (30.6%) and lowest in District 3 (18.3%). The percentage that spoke English and Chamorro/Carolinian at home was highest in District 5 (49.5%) and lowest in District 3 (13.7%). The percentage that spoke English and Filipino at home was highest in District 3 (43.7%) and lowest in District 5 (19.0%).
Population Characteristics
LFS 2017 Table P12.1 Main Language Spoken at Home by Island and by District: CNMI 2017 Fourth Qtr.
| Language at Home | CNMI Total |
Saipan Total |
Saipan Dist. 1 |
Saipan Dist. 2 |
Saipan Dist. 3 |
Saipan Dist. 4 |
Saipan Dist. 5 |
Tinian Dist. 6 |
Rota Dist. 7 |
|---|---|---|---|---|---|---|---|---|---|
| Note: Chamorro/Carolinian, Filipino and Other Asian Language are spoken with English. |
Source: Labor Force Survey CNMI, 2017 4th Qrt. | ||||||||
| English Only | 10,658 | 9,835 | 2,701 | 1,259 | 2,782 | 1,190 | 1,903 | 389 | 433 |
| Chamorro/Carolinian | 14,064 | 12,295 | 3,919 | 1,126 | 2,085 | 1,465 | 3,700 | 910 | 860 |
| Other Pacific Is Language | 2,941 | 2,889 | 1,301 | 373 | 804 | 326 | 85 | 23 | 29 |
| Filipino | 17,710 | 16,191 | 4,624 | 2,758 | 6,650 | 742 | 1,418 | 969 | 549 |
| Other Asian Languages | 6,076 | 5,625 | 1,734 | 911 | 2,556 | 162 | 262 | 285 | 166 |
| English & Other Languages | 278 | 261 | 38 | – | 138 | – | 85 | 6 | 11 |
| Less than 2 yrs | 536 | 468 | 98 | 140 | 203 | 8 | 19 | 44 | 24 |
LFS 2017 Table P12.1 Main Language Spoken at Home by Island and by District: CNMI 2017 Fourth Qtr. (Distribution Within)
| Language at Home | CNMI Total |
Saipan Total |
Saipan Dist. 1 |
Saipan Dist. 2 |
Saipan Dist. 3 |
Saipan Dist. 4 |
Saipan Dist. 5 |
Tinian Dist. 6 |
Rota Dist. 7 |
|---|---|---|---|---|---|---|---|---|---|
| Note: Chamorro/Carolinian, Filipino and Other Asian Language are spoken with English. |
Source: Labor Force Survey CNMI, 2017 4th Qrt. | ||||||||
| English Only | 20.40% | 20.70% | 18.70% | 19.20% | 18.30% | 30.60% | 25.50% | 14.80% | 20.90% |
| Chamorro/Carolinian | 26.90% | 25.80% | 27.20% | 17.10% | 13.70% | 37.60% | 49.50% | 34.60% | 41.50% |
| Other Pacific Is Language | 5.60% | 6.10% | 9.00% | 5.70% | 5.30% | 8.40% | 1.10% | 0.90% | 1.40% |
| Filipino | 33.90% | 34.00% | 32.10% | 42.00% | 43.70% | 19.10% | 19.00% | 36.90% | 26.50% |
| Other Asian Languages | 11.60% | 11.80% | 12.00% | 13.90% | 16.80% | 4.20% | 3.50% | 10.90% | 8.00% |
| English & Other Languages | 0.50% | 0.50% | 0.30% | 0.00% | 0.90% | 0.00% | 1.10% | 0.20% | 0.50% |
| Less than 2 yrs | 1.00% | 1.00% | 0.70% | 2.10% | 1.30% | 0.20% | 0.30% | 1.70% | 1.20% |
LFS 2017 Table P12.1 Main Language Spoken at Home by Island and by District: CNMI 2017 Fourth Qtr. (Distribution Amoung)
| Language at Home | CNMI Total |
Saipan Total |
Saipan Dist. 1 |
Saipan Dist. 2 |
Saipan Dist. 3 |
Saipan Dist. 4 |
Saipan Dist. 5 |
Tinian Dist. 6 |
Rota Dist. 7 |
|---|---|---|---|---|---|---|---|---|---|
| Note: Chamorro/Carolinian, Filipino and Other Asian Language are spoken with English. |
Source: Labor Force Survey CNMI, 2017 4th Qrt. | ||||||||
| English Only | 100% | 92.30% | 25.30% | 11.80% | 26.10% | 11.20% | 17.90% | 3.60% | 4.10% |
| Chamorro/Carolinian | 100% | 87.40% | 27.90% | 8.00% | 14.80% | 10.40% | 26.30% | 6.50% | 6.10% |
| Other Pacific Is Language | 100% | 98.20% | 44.20% | 12.70% | 27.30% | 11.10% | 2.90% | 0.80% | 1.00% |
| Filipino | 100% | 91.40% | 26.10% | 15.60% | 37.50% | 4.20% | 8.00% | 5.50% | 3.10% |
| Other Asian Languages | 100% | 92.60% | 28.50% | 15.00% | 42.10% | 2.70% | 4.30% | 4.70% | 2.70% |
| English & Other Languages | 100% | 93.90% | 13.50% | 0.00% | 49.80% | 0.00% | 30.60% | 2.00% | 4.00% |
| Less than 2 yrs | 100% | 87.30% | 18.40% | 26.00% | 37.90% | 1.50% | 3.50% | 8.30% | 4.50% |
Population Characteristics
To download, right click on the chart and select “Save Image As”…


