DescriptionTable DataChart and Figure Data
CBHS 2016
CBHS 2016
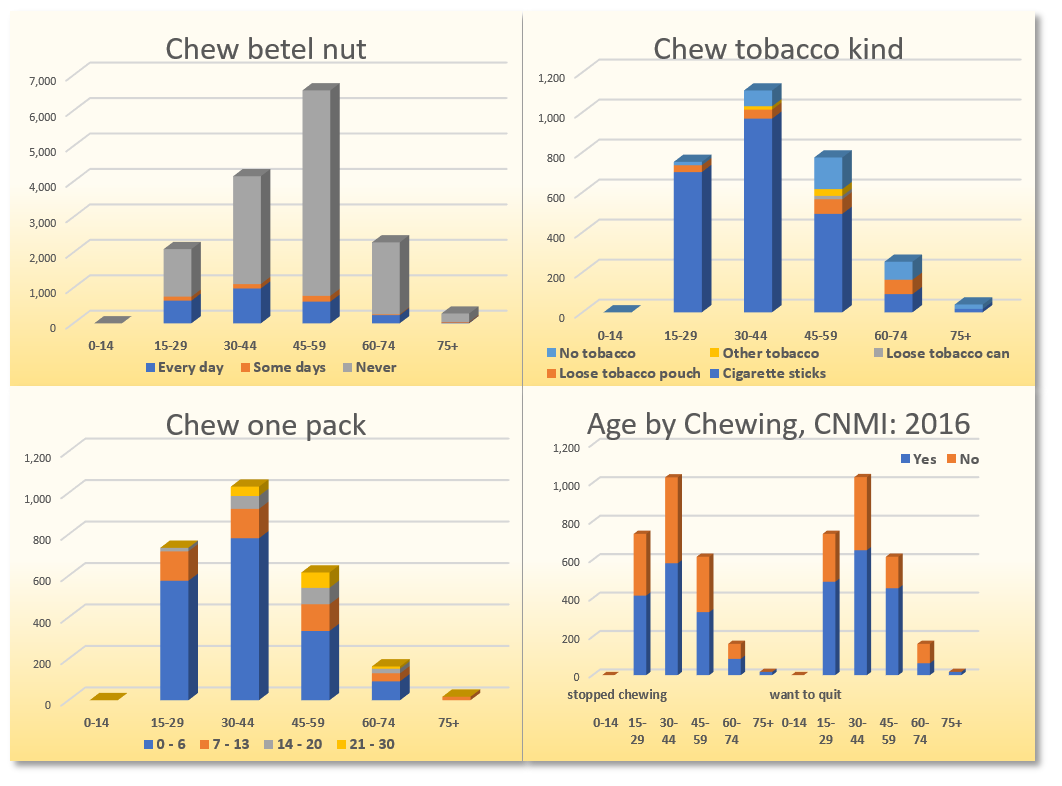
CBHS 2016 Table 20.19 Age by Chewing, CNMI: 2016
CNMI Behavioral Health Survey 2016
| 0-14 | 15-29 | 30-44 | 45-59 | 60-74 | 75+ | Median | ||
|---|---|---|---|---|---|---|---|---|
| Source: 2016 CNMI Health Survey (CBHS and NCDS) | ||||||||
| Chew betel nut | Every day | – | 639 | 984 | 611 | 231 | 17 | 39.2 |
| Chew betel nut | Some days | – | 113 | 124 | 164 | 22 | 22 | 43.3 |
| Chew betel nut | Never | – | 1,342 | 3,042 | 5,798 | 2,031 | 237 | 49.8 |
| chew tobacco kind | Cigarette sticks | – | 701 | 968 | 492 | 91 | 17 | 36.7 |
| chew tobacco kind | Loose tobacco pouch | – | 34 | 45 | 73 | 72 | – | 51.9 |
| chew tobacco kind | Loose tobacco can | – | – | – | 17 | – | – | 52.5 |
| chew tobacco kind | Other tobacco | – | – | 17 | 34 | – | – | 48.8 |
| chew tobacco kind | No tobacco | – | 17 | 79 | 158 | 90 | 22 | 53.3 |
| chew one pack | 0 – 6 | – | 576 | 781 | 334 | 91 | – | 36.1 |
| chew one pack | 7 – 13 | – | 142 | 142 | 129 | 39 | 17 | 39.8 |
| chew one pack | 14 – 20 | – | 17 | 62 | 79 | 22 | – | 47.1 |
| chew one pack | 21 – 30 | – | – | 45 | 74 | 11 | – | 49 |
| stopped chewing | Yes | – | 414 | 582 | 328 | 85 | 17 | 37.7 |
| stopped chewing | No | – | 321 | 447 | 288 | 78 | – | 38.3 |
| want to quit | Yes | – | 486 | 650 | 452 | 62 | 17 | 38 |
| want to quit | No | – | 249 | 380 | 164 | 101 | – | 37.8 |
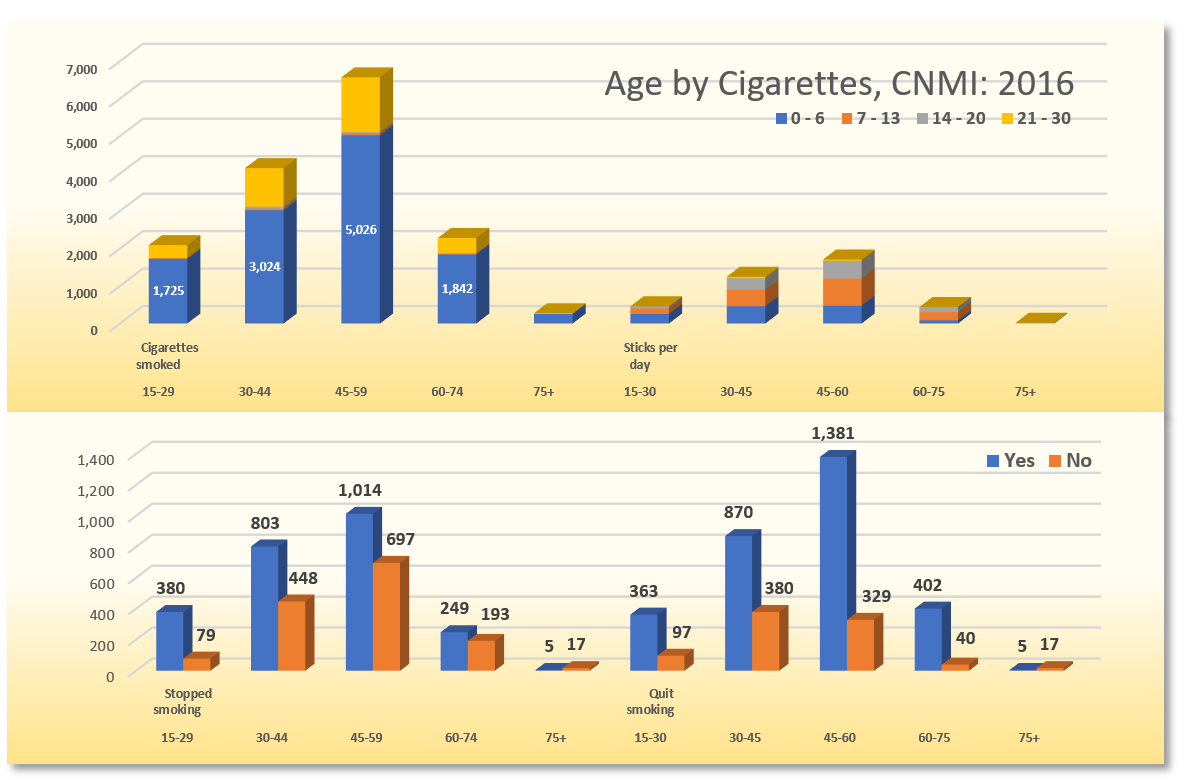
CBHS 2016 Table 20.20 Age by Cigarettes, CNMI: 2016
CNMI Behavioral Health Survey 2016
| 15-29 | 30-44 | 45-59 | 60-74 | 75+ | Median | ||
|---|---|---|---|---|---|---|---|
| Source: 2016 CNMI Health Survey (CBHS and NCDS) | |||||||
| Cigarettes smoked | 0 – 6 | 1,725 | 3,024 | 5,026 | 1,842 | 254 | 48.5 |
| Cigarettes smoked | 7 – 13 | 23 | 40 | 56 | 17 | – | 46.4 |
| Cigarettes smoked | 14 – 20 | – | 55 | 28 | 17 | – | 43.6 |
| Cigarettes smoked | 21 – 30 | 346 | 1,031 | 1,463 | 408 | 22 | 47.6 |
| Sticks per day | 0 – 6 | 255 | 463 | 475 | 85 | – | 42.4 |
| Sticks per day | 7 – 13 | 148 | 442 | 725 | 221 | – | 48.7 |
| Sticks per day | 14 – 20 | 57 | 306 | 477 | 136 | 22 | 49.3 |
| Sticks per day | 21 – 30 | – | 39 | 34 | – | – | 44 |
| Stopped smoking | Yes | 380 | 803 | 1,014 | 249 | 5 | 45.6 |
| Stopped smoking | No | 79 | 448 | 697 | 193 | 17 | 49.1 |
| Quit smoking | Yes | 363 | 870 | 1,381 | 402 | 5 | 48 |
| Quit smoking | No | 97 | 380 | 329 | 40 | 17 | 43.2 |
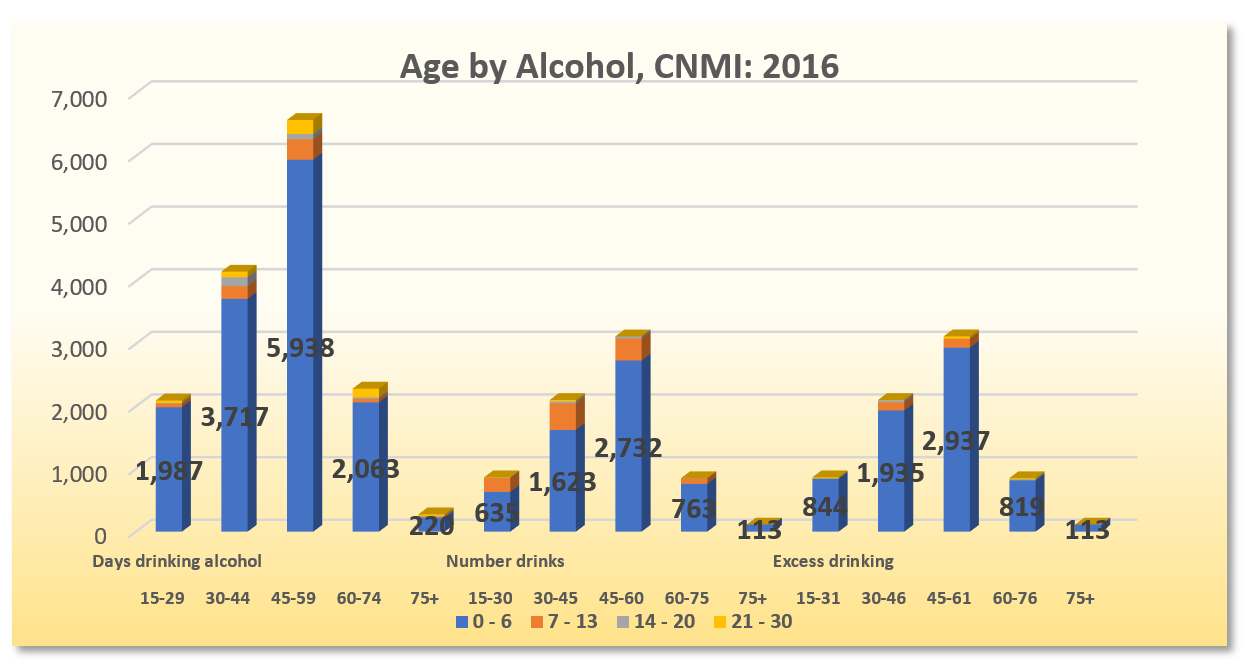
CBHS 2016 Table 20.21 Age by Alcohol, CNMI: 2016
CNMI Behavioral Health Survey 2016
| 15-29 | 30-44 | 45-59 | 60-74 | 75+ | Median | ||
|---|---|---|---|---|---|---|---|
| Source: 2016 CNMI Health Survey (CBHS and NCDS) | |||||||
| Days drinking alcohol | 0 – 6 | 1,987 | 3,717 | 5,938 | 2,063 | 220 | 48.2 |
| Days drinking alcohol | 7 – 13 | 56 | 203 | 328 | 57 | 17 | 48.3 |
| Days drinking alcohol | 14 – 20 | 11 | 141 | 80 | 23 | 17 | 43.3 |
| Days drinking alcohol | 21 – 30 | 40 | 90 | 227 | 141 | 22 | 53.6 |
| Number drinks | 0 – 6 | 635 | 1,623 | 2,732 | 763 | 113 | 48.7 |
| Number drinks | 7 – 13 | 221 | 424 | 351 | 85 | – | 41.3 |
| Number drinks | 14 – 20 | 5 | 33 | 34 | 5 | – | 45.2 |
| Number drinks | 21 – 30 | 6 | 22 | – | – | – | 35.5 |
| Excess drinking | 0 – 6 | 844 | 1,935 | 2,937 | 819 | 113 | 47.8 |
| Excess drinking | 7 – 13 | – | 129 | 142 | – | – | 45.7 |
| Excess drinking | 14 – 20 | 6 | 33 | – | 17 | – | 40 |
| Excess drinking | 21 – 30 | 17 | 5 | 39 | 17 | – | 51.5 |
CBHS 2016
To download, right click on the chart and select “Save Image As”…