


CPI Construction and Methodology
As with most CPIs around the world, the CSD will continue to use the Laspeyres method to calculate the CPI. This is the most widely-used and internationally-accepted method of calculating price change for a CPI. The Laspeyres formula is shown below:
Laspeyres Formula:
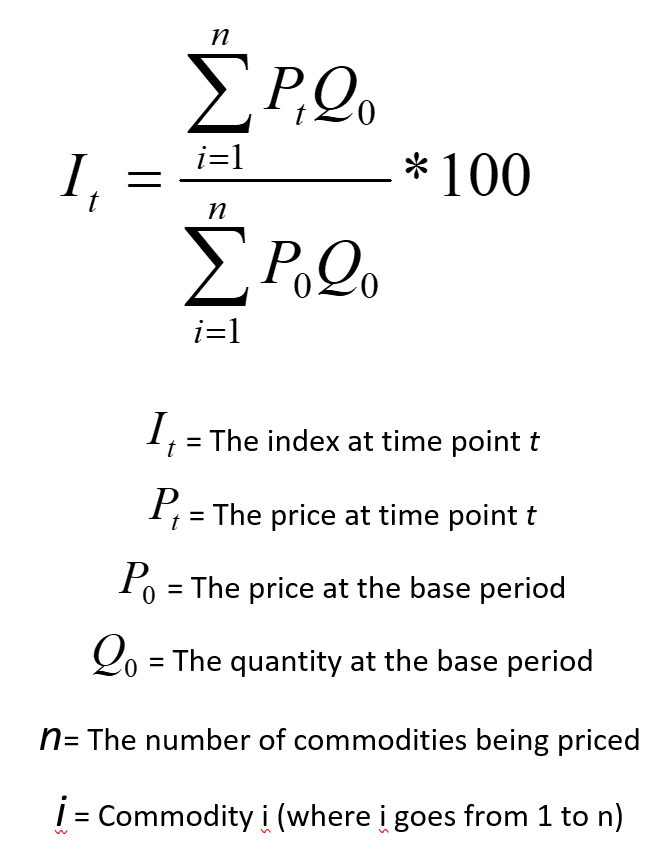
This method of index computation uses the quantities of commodities purchased in the base period as the basis for computing the value of the “market basket.” First, there are n number of items in the market basket with each having a base quantity. Each of these items has a base price, the p0 and current price, pi. Multiplying p0 with q0 gives the total expenditure for a particular commodity for the base period. Current expenditure for an item is obtained by multiplying pi with q0. The sum of current expenditures for all items in the market basket is expressed as ? piq0, while the sum ?p0q0 is the total market basket expenditures in the base period. Notice that in both summations the term q0 remains constant, which means by using the same quantities only price changes are reflected in two pricing periods.
For those unfamiliar with statistical notation, trying to read and understand the above explanation can be an intimidating experience. In layman’s terms, the above simply means that CSD data collectors price the same quality of all sample items in the CPI every quarter and the prices for each item in the current quarter are compared to the same prices in the previous quarter. The base period is the 2nd Quarter 2017 when the CPI was set equal to 100. That is when the CPIs for each of the 9 major groups and the All Items CPI = 100.
The CSD uses a slight variation to this formula. Each quarter, the average of the prices that are collected for each item are compared to the average of the same prices in the previous quarter – not the base period. This is only done for items which are priced in both quarters. The total of the comparable prices of an item in the current quarter is divided by the total of the comparable prices in the previous quarter to calculate a price relative. This price relative is multiplied by the item’s weight in the previous quarter to update the item’s weight in the current quarter. This product is then divided by the item’s weight in the base period to calculate an item’s CPI. By summing the updated weights for all of the items in a group and then dividing that sum by the same weights in the base period will calculate the group’s current CPI.
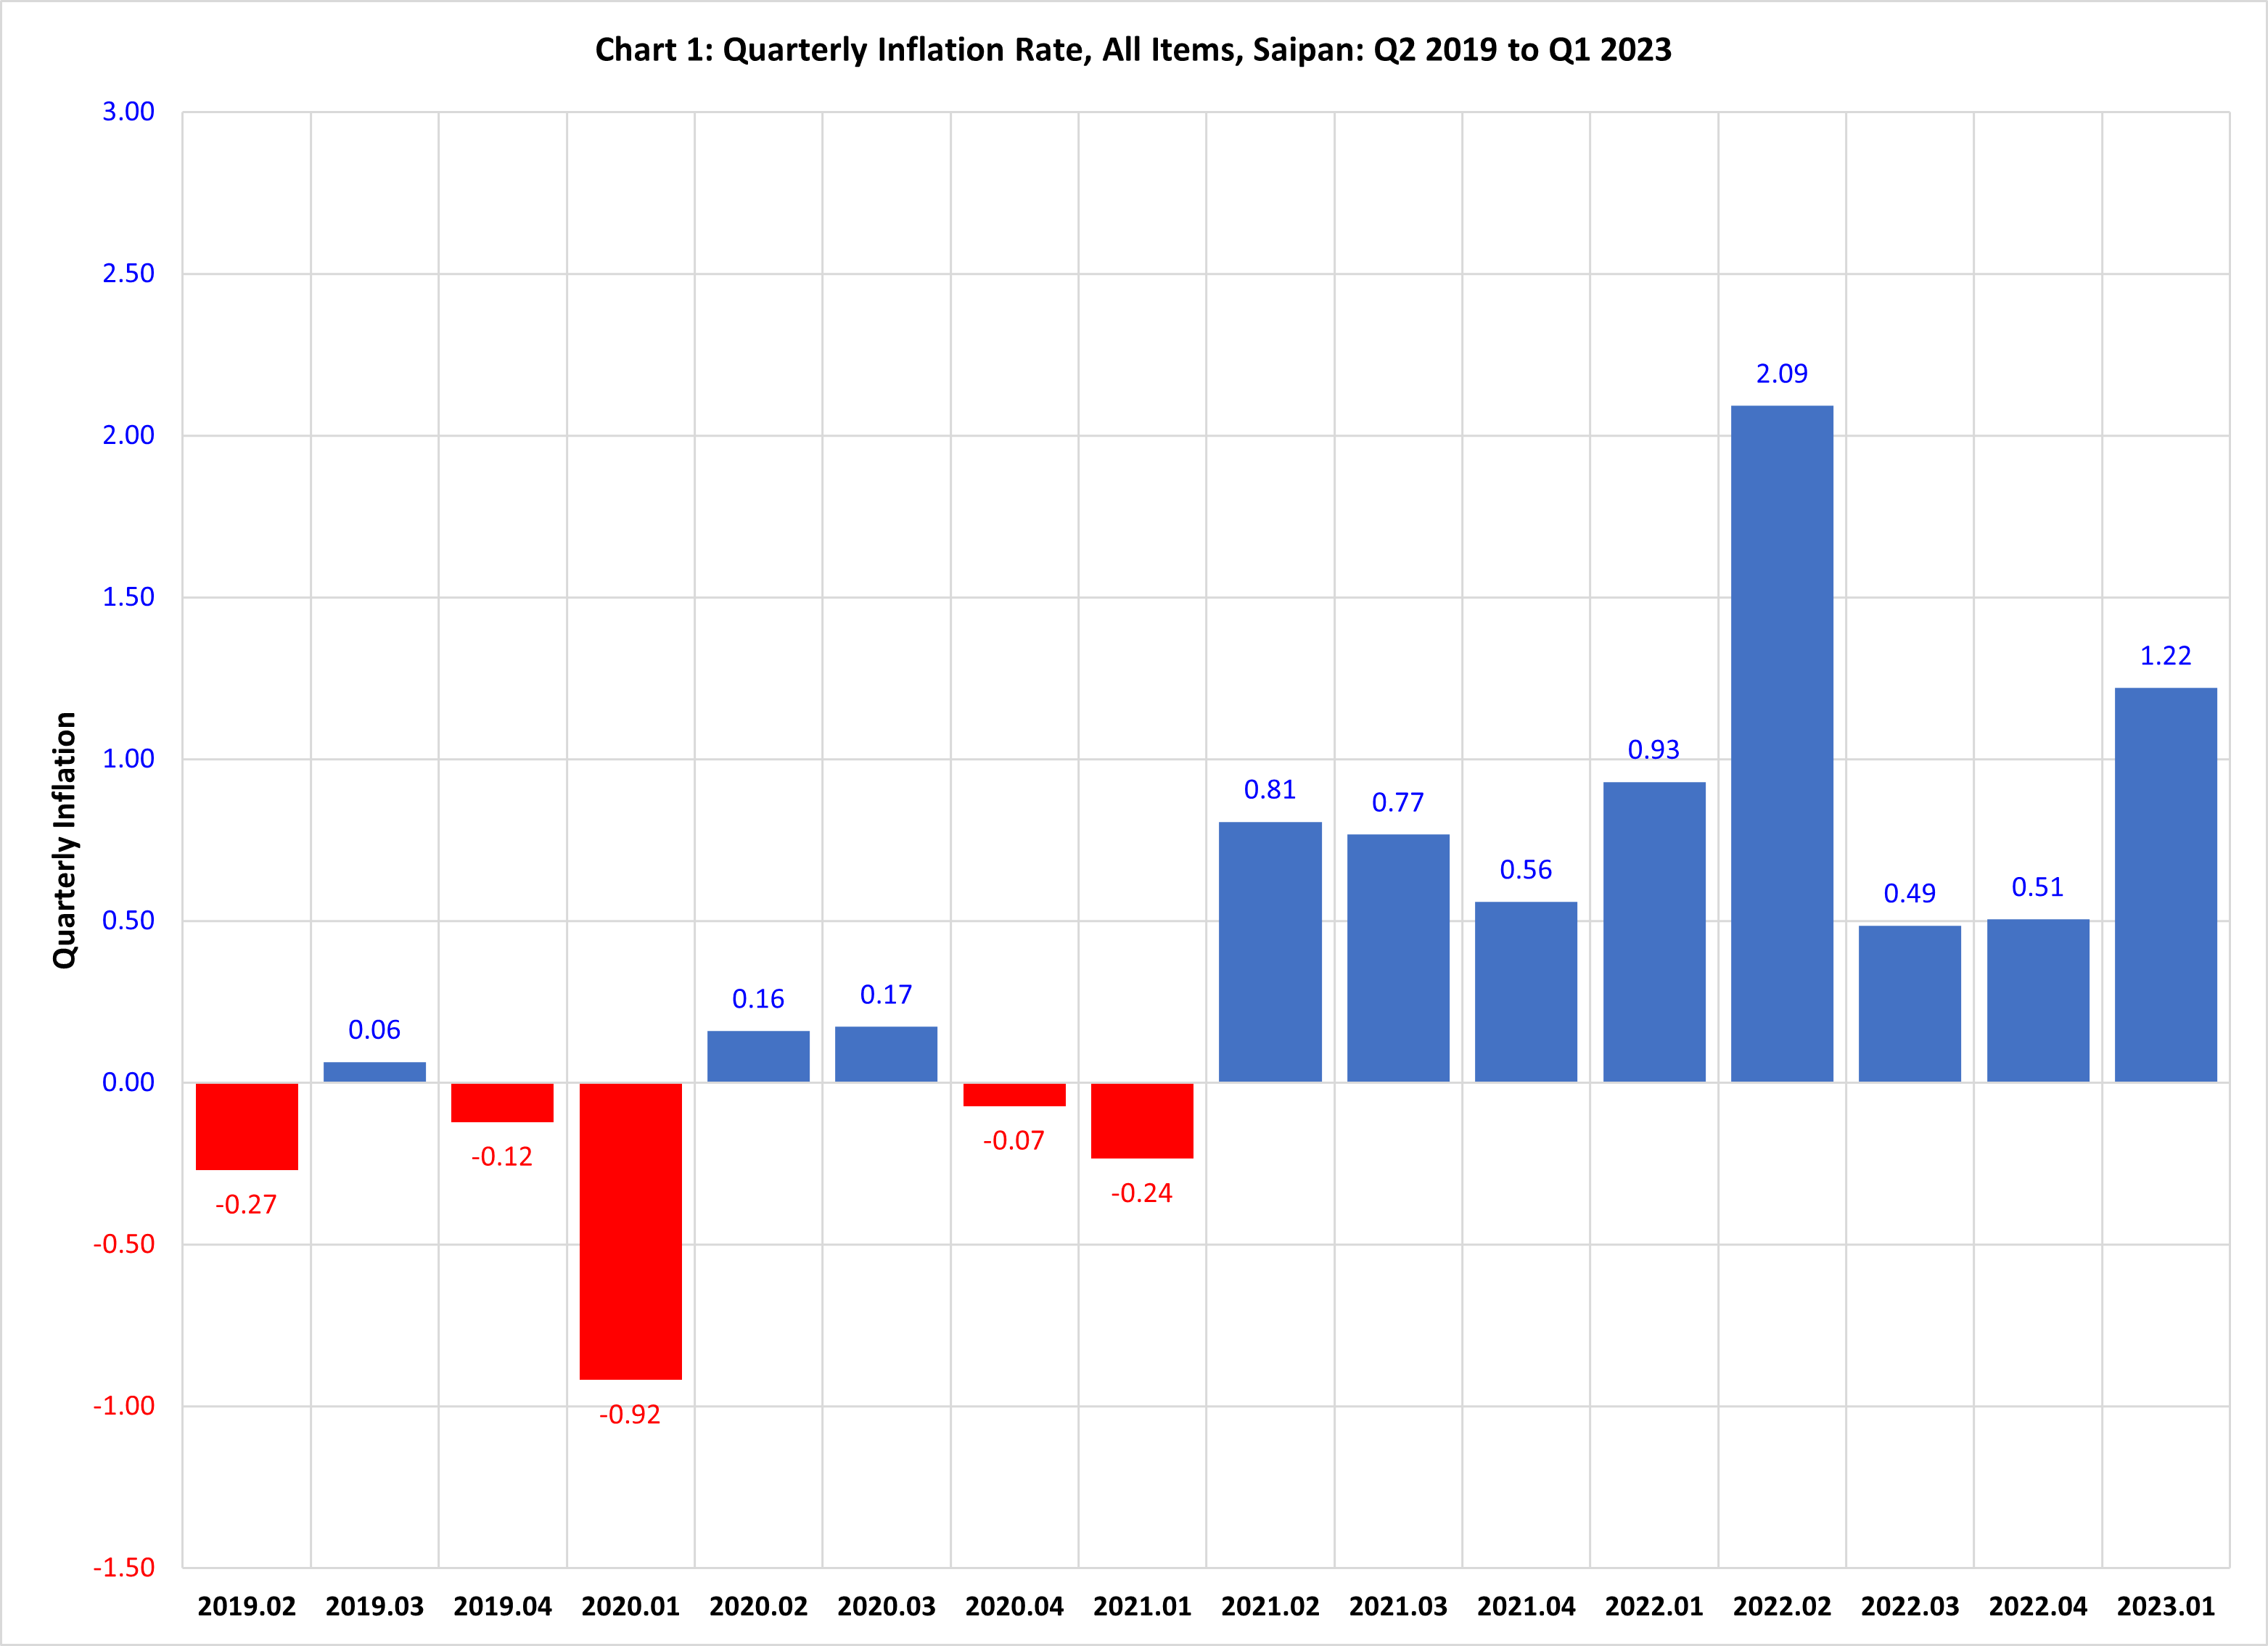
Section 1: Quarterly Inflation
CNMI CPI Table 1: Quarterly Inflation, by Group, Saipan
| Year | Quarter | All Items | Food | Alcoholic Beverages | Housing & Utilities | Apparel | Transportation | Medical Care | Recreation | Education & Communication | Other Goods & Services |
|---|---|---|---|---|---|---|---|---|---|---|---|
| Source: CNMI Consumer Price Index | |||||||||||
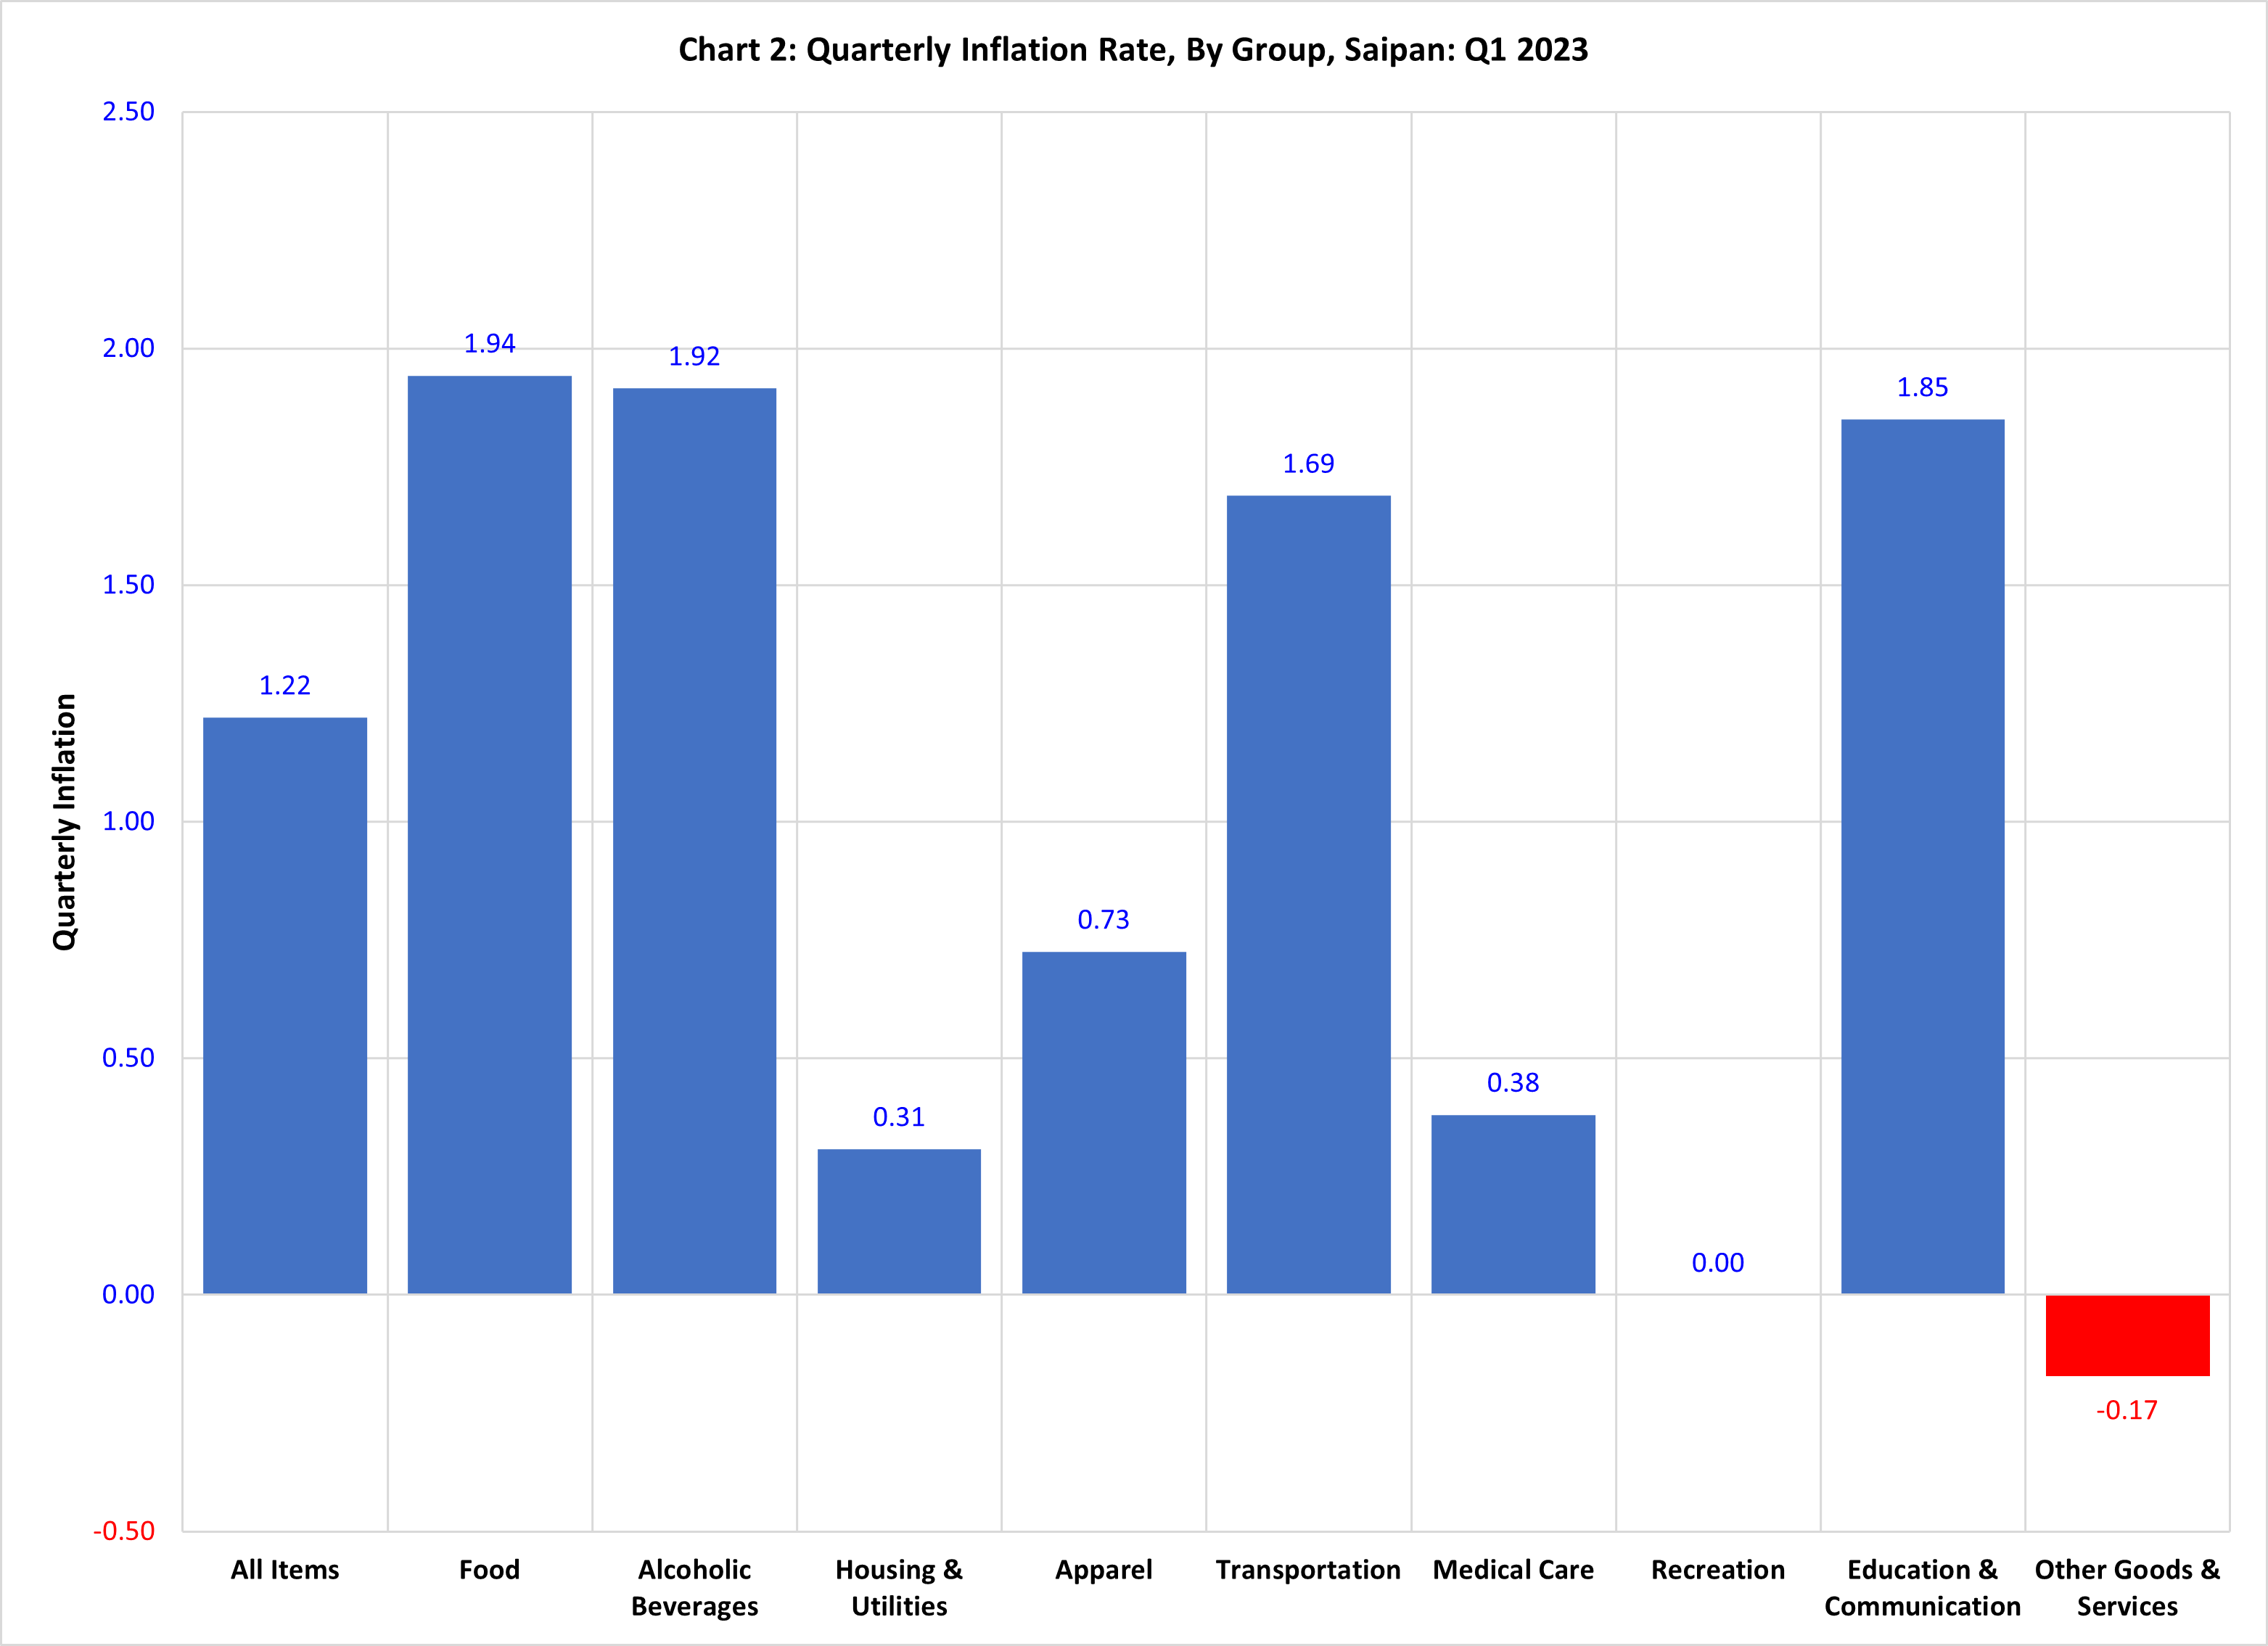
| 2023 | 1st Qtr | 1.22 | 1.94 | 1.92 | 0.31 | 0.73 | 1.69 | 0.38 | 0 | 1.85 | -0.17 |
| 2022 | 4th Qtr | 0.51 | 1.25 | 5.66 | 0.55 | -0.02 | -0.41 | 0.05 | 0.44 | 2.65 | -0.4 |
| 2022 | 3rd Qtr | 0.49 | 2.86 | 2.97 | 1.52 | 0.13 | -1.7 | -4.13 | 2.74 | -1.05 | 0.05 |
| 2022 | 2nd Qtr | 2.09 | 1.37 | 2.27 | 0.44 | 1.4 | 4.39 | 2.7 | -0.09 | 2.32 | 3.36 |
| 2022 | 1st Qtr | 0.93 | 2.01 | 2.62 | 1.04 | 0.27 | 0.19 | 0.31 | 2.07 | 0.67 | 0.69 |
| 2021 | 4th Qtr | 0.56 | 1.34 | 0 | 0.42 | 0.07 | -0.03 | 2.01 | -0.2 | 1.21 | 0.58 |
| 2021 | 3rd Qtr | 0.77 | 1.71 | 0.22 | 0.77 | 0 | 0.15 | -0.12 | 2.39 | 1.56 | -0.43 |
| 2021 | 2nd Qtr | 0.81 | 0.91 | -0.22 | 0.72 | 0.15 | 1.17 | 2.25 | 0 | -0.06 | 0.4 |
| 2021 | 1st Qtr | -0.24 | -0.51 | 0.22 | 0.54 | 0.14 | -0.89 | 0 | -0.73 | 0 | -0.2 |
| 2020 | 4th Qtr | -0.07 | 0.22 | 0.22 | 0.32 | -0.09 | -0.35 | -4.22 | 0 | 0.01 | 0 |
| 2020 | 3rd Qtr | 0.17 | -0.03 | 0 | -0.53 | 0.03 | 0.74 | 0.64 | 0 | 1.46 | -0.12 |
| 2020 | 2nd Qtr | 0.16 | -0.27 | 0 | -0.22 | 0 | 0.23 | 0.63 | 0 | 2.37 | 2.54 |
| 2020 | 1st Qtr | -0.92 | -0.22 | 0 | -0.52 | -0.25 | -2.28 | -0.42 | 1.09 | -0.87 | -0.26 |
| 2019 | 4th Qtr | -0.12 | 0.44 | 0 | 0.16 | -0.05 | 0.01 | 0 | -8.16 | -2.36 | 0.26 |
| 2019 | 3rd Qtr | 0.06 | -0.24 | 0.25 | 0.4 | 0.5 | -0.08 | -0.21 | -1.37 | 0 | 0.97 |
| 2019 | 2nd Qtr | -0.27 | -0.91 | -0.19 | 0.32 | -0.06 | 0 | -2.76 | 0 | -1 | -0.09 |
| 2019 | 1st Qtr | -0.68 | -0.09 | -1.19 | -0.33 | 2.64 | -2.96 | 0.49 | 2.31 | 0.32 | -0.54 |
| 2018 | 4th Qtr | 2.91 | 0.29 | 0.76 | 0.58 | -1.56 | 10.06 | 0.33 | -0.7 | 0.11 | 2.54 |
| 2018 | 3rd Qtr | -0.3 | 0.39 | 0 | 0.26 | -1 | -1.84 | 0 | 0 | 2.16 | 0.88 |
| 2018 | 2nd Qtr | 0.88 | -0.11 | 0 | -0.26 | 0.06 | 3.55 | 0 | 0.21 | -0.1 | 0.21 |
| 2018 | 1st Qtr | -1.65 | 0.97 | 0 | -1.32 | 0.94 | -6.12 | 0.34 | 0 | 1.77 | 0.72 |
| 2017 | 4th Qtr | -0.25 | 1.02 | 0 | 0.87 | 1.06 | -3.14 | 2.99 | -0.44 | -0.35 | 3.41 |
| 2017 | 3rd Qtr | -0.24 | -0.25 | 0 | -0.14 | -0.98 | 0 | -1.98 | 0 | -0.3 | 0.34 |
| 2017 | 2nd Qtr | 0.17 | -0.14 | 0 | 0.51 | 2.53 | -0.69 | 0.01 | 0 | 0.08 | 2.49 |
| 2017 | 1st Qtr | 3.2 | 0.83 | 0 | 12.63 | -2.63 | -0.03 | 0.05 | -0.39 | 0.04 | 1.24 |
| 2016 | 4th Qtr | 0.3 | 0.04 | 0 | 0.86 | 0.01 | 0.36 | 0 | -0.27 | 0 | 0.03 |
| 2016 | 3rd Qtr | 0.21 | -1.18 | 0.9 | -0.43 | -0.11 | 2.13 | 0 | 0.24 | 0 | 0.33 |
| 2016 | 2nd Qtr | 1.3 | 0.45 | -3.06 | 3.49 | -0.15 | 1.73 | 0 | 0 | 0 | 0.11 |
| 2016 | 1st Qtr | 0.28 | -0.4 | 0 | -3.85 | -0.01 | -1.9 | 0.29 | 44.4 | 6.99 | -0.13 |
| 2015 | 4th Qtr | 0.08 | 0.31 | 0 | 0.07 | 0.1 | 0 | 0 | 0 | 0 | 0 |
| 2015 | 3rd Qtr | -1.52 | -0.3 | 2.6 | -3.2 | -0.05 | -2.73 | 0 | -0.07 | 0.11 | 0.05 |
| 2015 | 2nd Qtr | 0.86 | 0.06 | 0 | 2.36 | 0 | 1.04 | 0 | -0.26 | 0.04 | 0 |
| 2015 | 1st Qtr | -3.5 | 0.7 | 0 | -6.73 | 1.19 | -7.97 | 0 | -0.2 | 0 | 4.3 |
| 2014 | 4th Qtr | 0.45 | 3.44 | 0.45 | -3.34 | 0.33 | 1.56 | 0.15 | 0.01 | -0.38 | 11.15 |
| 2014 | 3rd Qtr | -0.64 | 0.05 | 0 | -1.86 | -1.75 | 0 | 0.08 | -2.08 | 0.46 | 0 |
| 2014 | 2nd Qtr | 0.8 | 0.75 | 1.37 | 1.38 | 0.09 | 0.72 | 0.06 | 2.2 | 0 | 0.02 |
| 2014 | 1st Qtr | 0.48 | 1.81 | 0.92 | -0.5 | 1.02 | 1.07 | 0.24 | 0.37 | -1.54 | 0.11 |
| 2013 | 4th Qtr | -0.23 | 0.04 | 0 | -0.22 | -0.03 | -0.66 | 0 | -0.14 | 0 | -0.16 |
| 2013 | 3rd Qtr | -1.03 | 1.31 | 1.98 | -0.03 | -0.49 | 0.55 | -10.34 | -0.44 | 0.31 | 0.26 |
| 2013 | 2nd Qtr | -0.16 | 0.24 | 0 | 0.09 | -0.88 | -0.72 | 0 | 0.04 | 0 | 0 |
| 2013 | 1st Qtr | -1.11 | 0.18 | 1.73 | 0.27 | -0.34 | -3.26 | 1.11 | -0.49 | -10.14 | 0.02 |
| 2012 | 4th Qtr | 1.11 | -0.19 | 0 | 1.71 | -1.47 | 2.02 | 1.69 | -0.11 | 0.43 | 0 |
| 2012 | 3rd Qtr | 0.28 | 0.03 | 0.48 | -0.78 | -2.21 | 1.82 | 0.97 | -0.21 | 0.53 | 0.07 |
| 2012 | 2nd Qtr | -0.79 | 0.22 | 1.46 | -0.57 | -0.65 | -3.39 | 2.09 | 0 | -1.08 | 0.19 |
| 2012 | 1st Qtr | 0.48 | -0.1 | 3.43 | 0.12 | -1.2 | 1.62 | -0.07 | 2.72 | -0.15 | 0.17 |
| 2011 | 4th Qtr | 0.14 | -0.4 | -4.4 | 0.54 | 1.31 | 0.14 | 0 | -0.95 | 0.6 | 0.18 |
| 2011 | 3rd Qtr | 2.84 | 1.36 | 0.43 | 1.22 | 0.83 | 2.63 | 13.29 | -0.01 | 0.36 | 0.25 |
| 2011 | 2nd Qtr | 0.78 | 2.6 | 0 | 0.35 | -0.44 | 1.06 | 0.03 | -0.16 | 0.02 | 0.16 |
| 2011 | 1st Qtr | -1.38 | 2.03 | 0.68 | -6.71 | -0.57 | 0.45 | -0.12 | 1.55 | -0.32 | 5.61 |
| 2010 | 4th Qtr | 4.04 | 1.35 | 2.64 | 0.99 | 0.2 | 6.05 | 19.93 | -0.27 | -0.37 | 1.87 |
| 2010 | 3rd Qtr | 0.3 | -0.36 | 0 | 0.08 | -0.1 | 2.06 | -1.01 | -0.95 | -0.23 | -0.06 |
| 2010 | 2nd Qtr | 0.52 | 0.43 | 0 | 1.11 | -2.46 | 0.74 | 0.08 | 0.78 | 0 | 1.73 |
| 2010 | 1st Qtr | 0.58 | -1.47 | 0.89 | -0.92 | -1.5 | 4.83 | 2.05 | -2.08 | -0.66 | -0.38 |
| 2009 | 4th Qtr | 3.41 | -0.42 | 0 | 9.29 | 0.91 | 2.94 | 0.06 | 0.19 | 0.33 | 0.41 |
| 2009 | 3rd Qtr | 0.28 | 2.52 | 0.45 | -2.78 | 3.37 | 1.32 | -3.2 | 0.37 | 8.71 | 1.01 |
| 2009 | 2nd Qtr | 1.67 | 1.42 | 8.37 | 1.48 | 0.03 | 3.43 | 0 | 3.2 | -0.14 | -0.03 |
| 2009 | 1st Qtr | -0.04 | 0.89 | -2.15 | -1.1 | -0.04 | 0.5 | 1.63 | 0 | -2.83 | 1.55 |
| 2008 | 4th Qtr | -3.78 | 2.57 | 0.81 | -14.05 | 0.53 | 4.28 | 3 | 0 | 0.49 | 0 |
| 2008 | 3rd Qtr | -1.05 | 4.32 | 3.49 | -3.2 | -0.6 | -3.33 | -2.92 | -0.52 | 0.99 | 7.69 |
| 2008 | 2nd Qtr | 11.94 | 0.33 | 0.84 | 32.73 | -1.07 | 3.37 | 0 | -2.93 | 0 | 0 |
| 2008 | 1st Qtr | -1.37 | 4.22 | 2.07 | -6.68 | 0.11 | 0 | 7.14 | 1.5 | -0.06 | 0 |
| 2007 | 4th Qtr | 0.31 | 1.02 | 0.45 | 0.32 | 0 | 0 | 0 | 0.27 | 0 | 0 |
| 2007 | 3rd Qtr | 0.12 | 0.42 | 0 | 0.08 | 0.24 | 0 | 0 | 0.43 | 0 | 0 |
| 2007 | 2nd Qtr | 2.21 | 1.34 | -0.02 | 5.65 | 0.28 | 0 | 1.12 | 0.14 | -0.15 | 0 |
| 2007 | 1st Qtr | 0.54 | 1.73 | 3.82 | 0.3 | 1.61 | 0 | 0 | 0.32 | 0.41 | 0 |
| 2006 | 4th Qtr | 0.58 | 1.99 | 0.06 | 0.61 | 0.27 | 0 | 0 | -1.15 | 0.46 | 0 |
| 2006 | 3rd Qtr | 10.91 | 1.13 | 0.02 | 38.46 | 0.97 | 0 | 0 | 2.11 | 0.13 | 0 |
| 2006 | 2nd Qtr | 0.33 | 0.11 | 0 | 1.02 | 0.5 | 0 | 0 | 0.6 | 0 | 0 |
| 2006 | 1st Qtr | 1.3 | 1.14 | 0.48 | 1.62 | 13.43 | 0.33 | 6.47 | 2.58 | 0.56 | 0 |
| 2005 | 4th Qtr | 0.61 | -0.39 | 0.08 | 2.34 | -0.58 | 0 | -0.25 | 0.84 | 1.08 | 0 |
| 2005 | 3rd Qtr | 0.19 | 0.33 | 0.36 | 0.14 | -3.64 | 0.27 | 0.09 | -0.65 | 1.37 | 0 |
| 2005 | 2nd Qtr | 0.26 | 0.75 | 1.26 | 0.09 | -1.41 | 0.14 | 0 | 2.71 | 0.39 | 0.03 |
| 2005 | 1st Qtr | 0.1 | -0.47 | 0.1 | 0.2 | 5.83 | 0.4 | 0 | 0.2 | -2.87 | 0 |
| 2004 | 4th Qtr | 0.7 | 2.09 | -0.2 | 0.62 | -3.04 | 0.2 | 0 | -0.3 | 2.23 | 0 |
| 2004 | 3rd Qtr | -0.38 | 1.06 | 0.4 | -0.31 | -4.31 | -0.89 | 0 | -2.58 | -0.9 | 0 |
| 2004 | 2nd Qtr | 0.68 | 0.97 | -0.2 | -0.61 | -1.09 | 0.4 | 0 | 6.2 | 0.1 | 8.3 |
| 2004 | 1st Qtr | 0.63 | 2.55 | 0 | 0.41 | 0.4 | 0 | 0 | -0.73 | -0.1 | 0 |
| 2003 | 4th Qtr | -0.22 | -0.13 | -0.1 | -1.31 | -0.45 | 0.77 | 0 | -2.79 | -0.6 | 0 |
| 2003 | 3rd Qtr | -0.1 | 0.37 | -0.18 | -0.8 | 0.77 | 0.03 | 0 | -0.26 | 0.4 | 0 |
| 2003 | 2nd Qtr | -0.1 | 0.29 | 0.18 | 0 | 0.18 | -0.3 | 0 | -0.68 | -0.2 | 0 |
| 2003 | 1st Qtr | – | – | – | – | – | – | – | – | – | – |
To download, right click on the chart and select “Save Image As”…
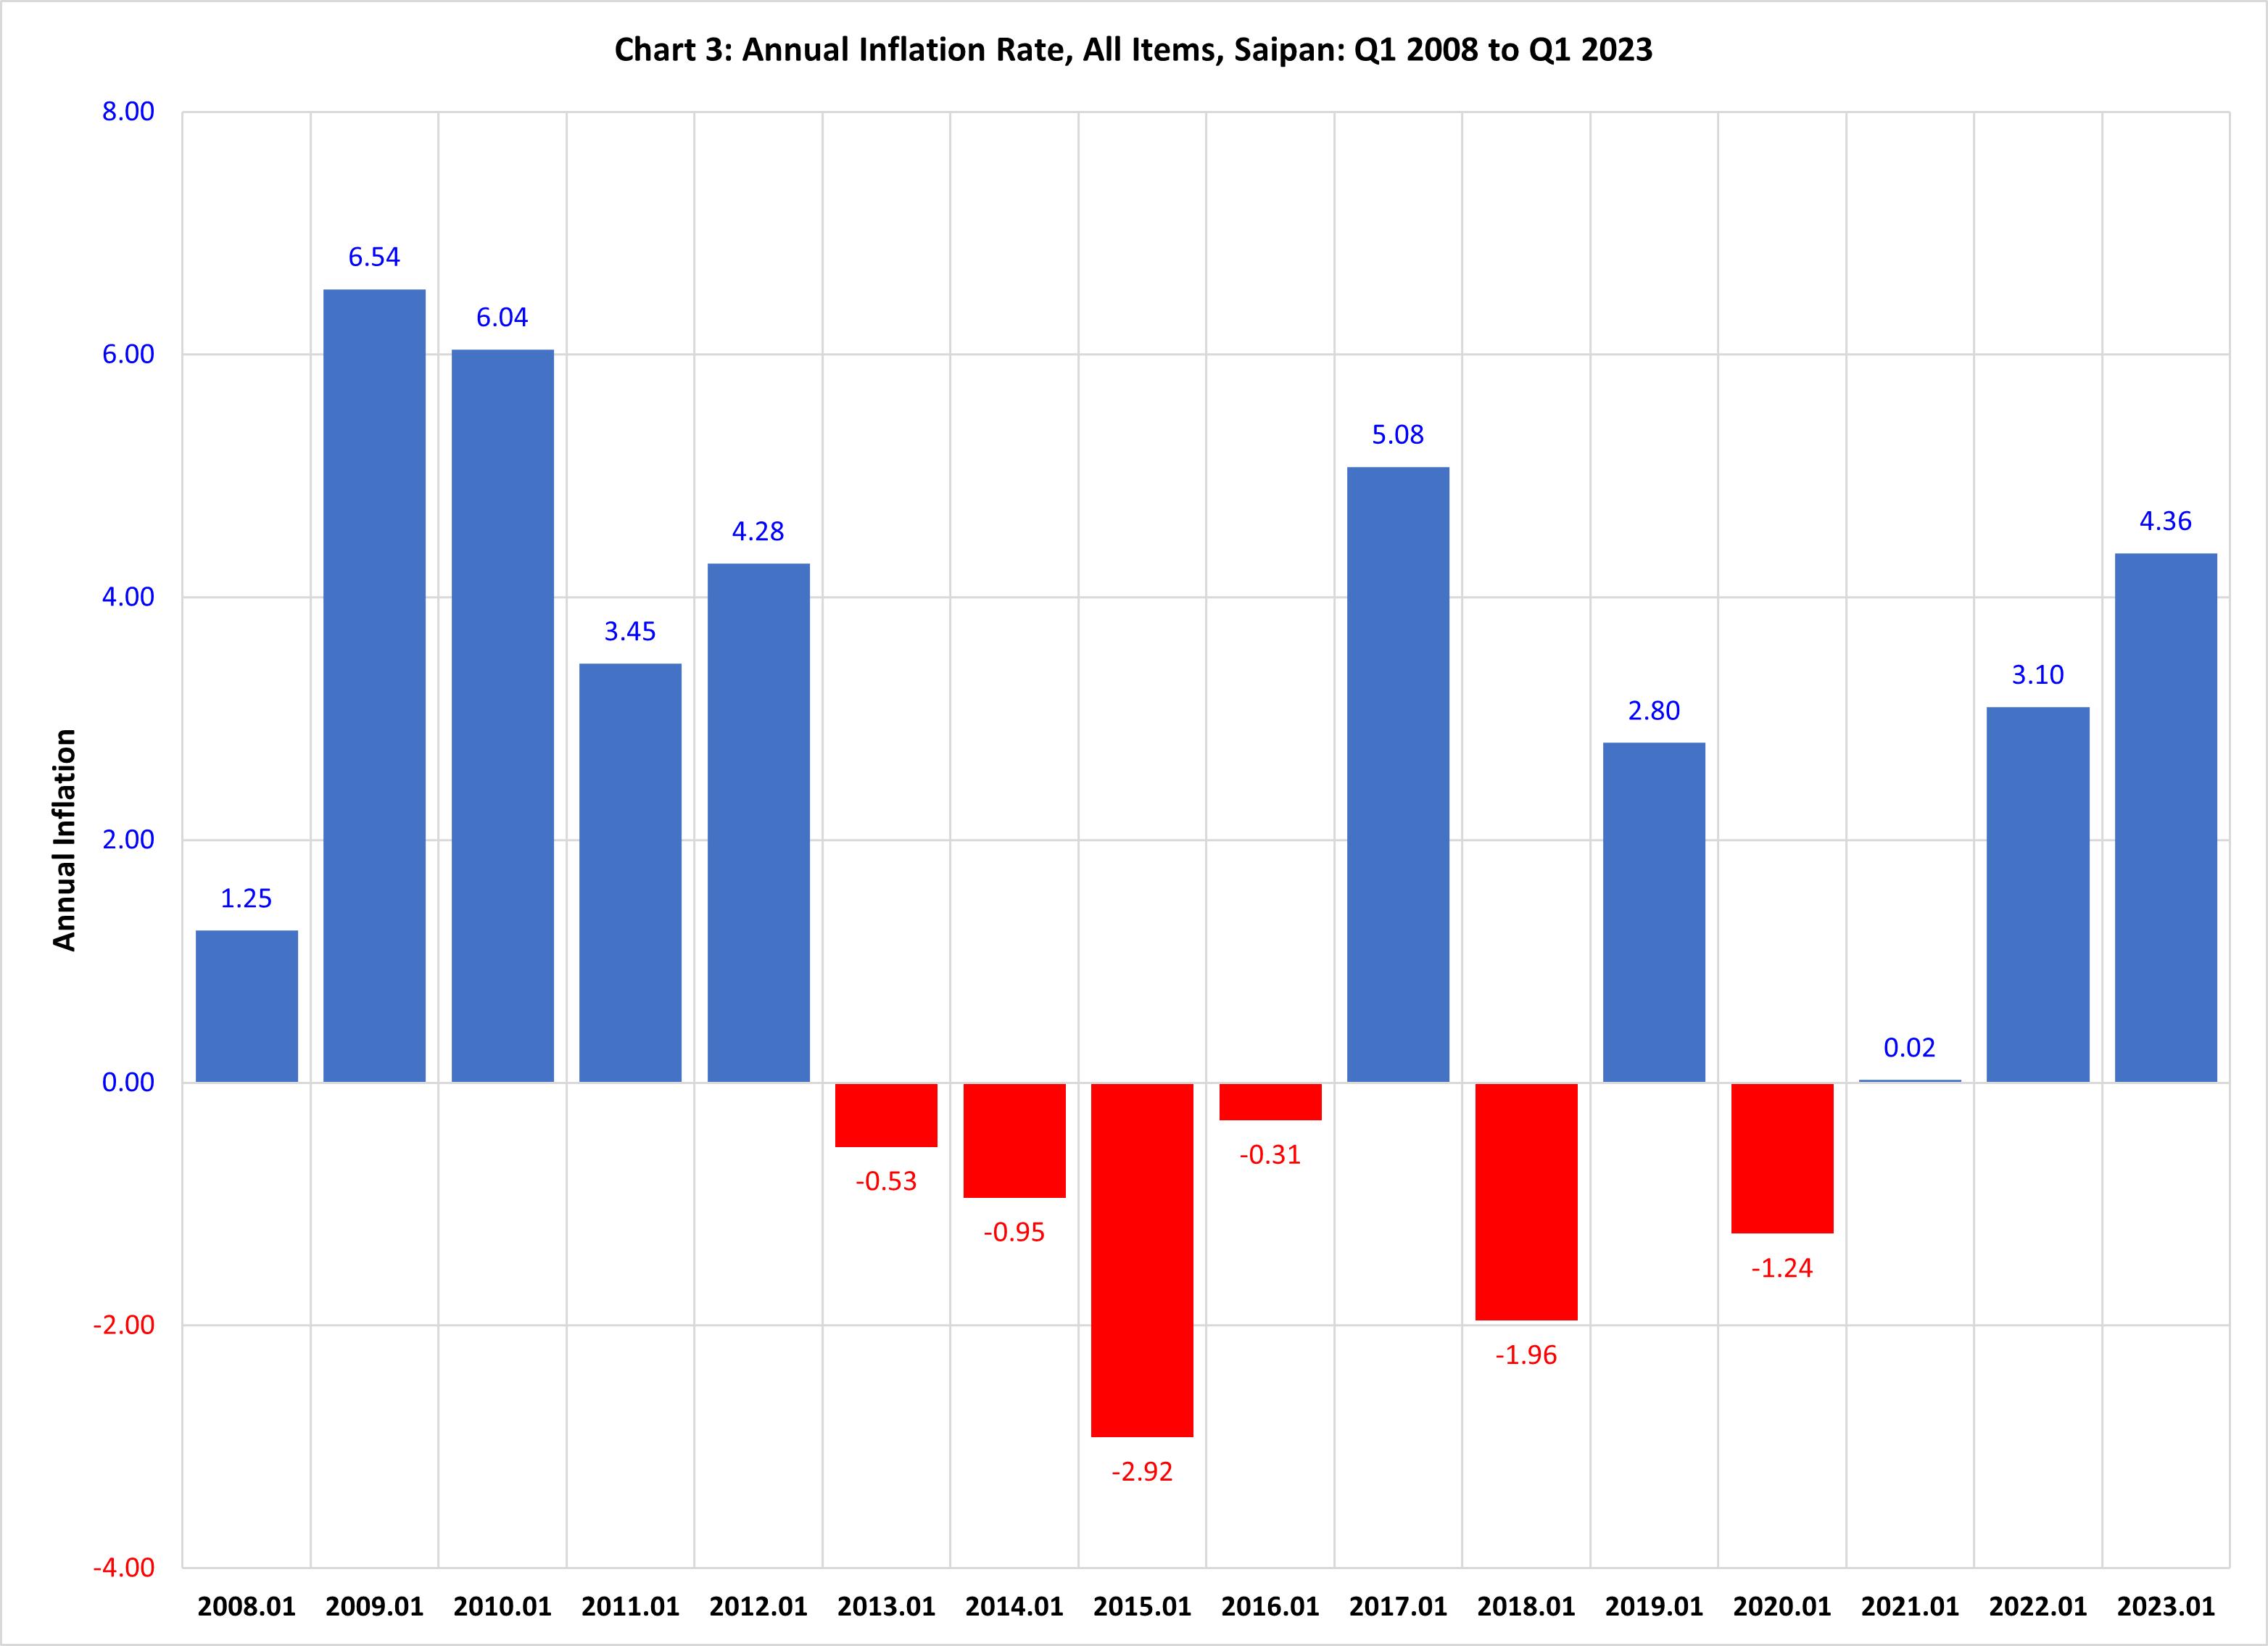
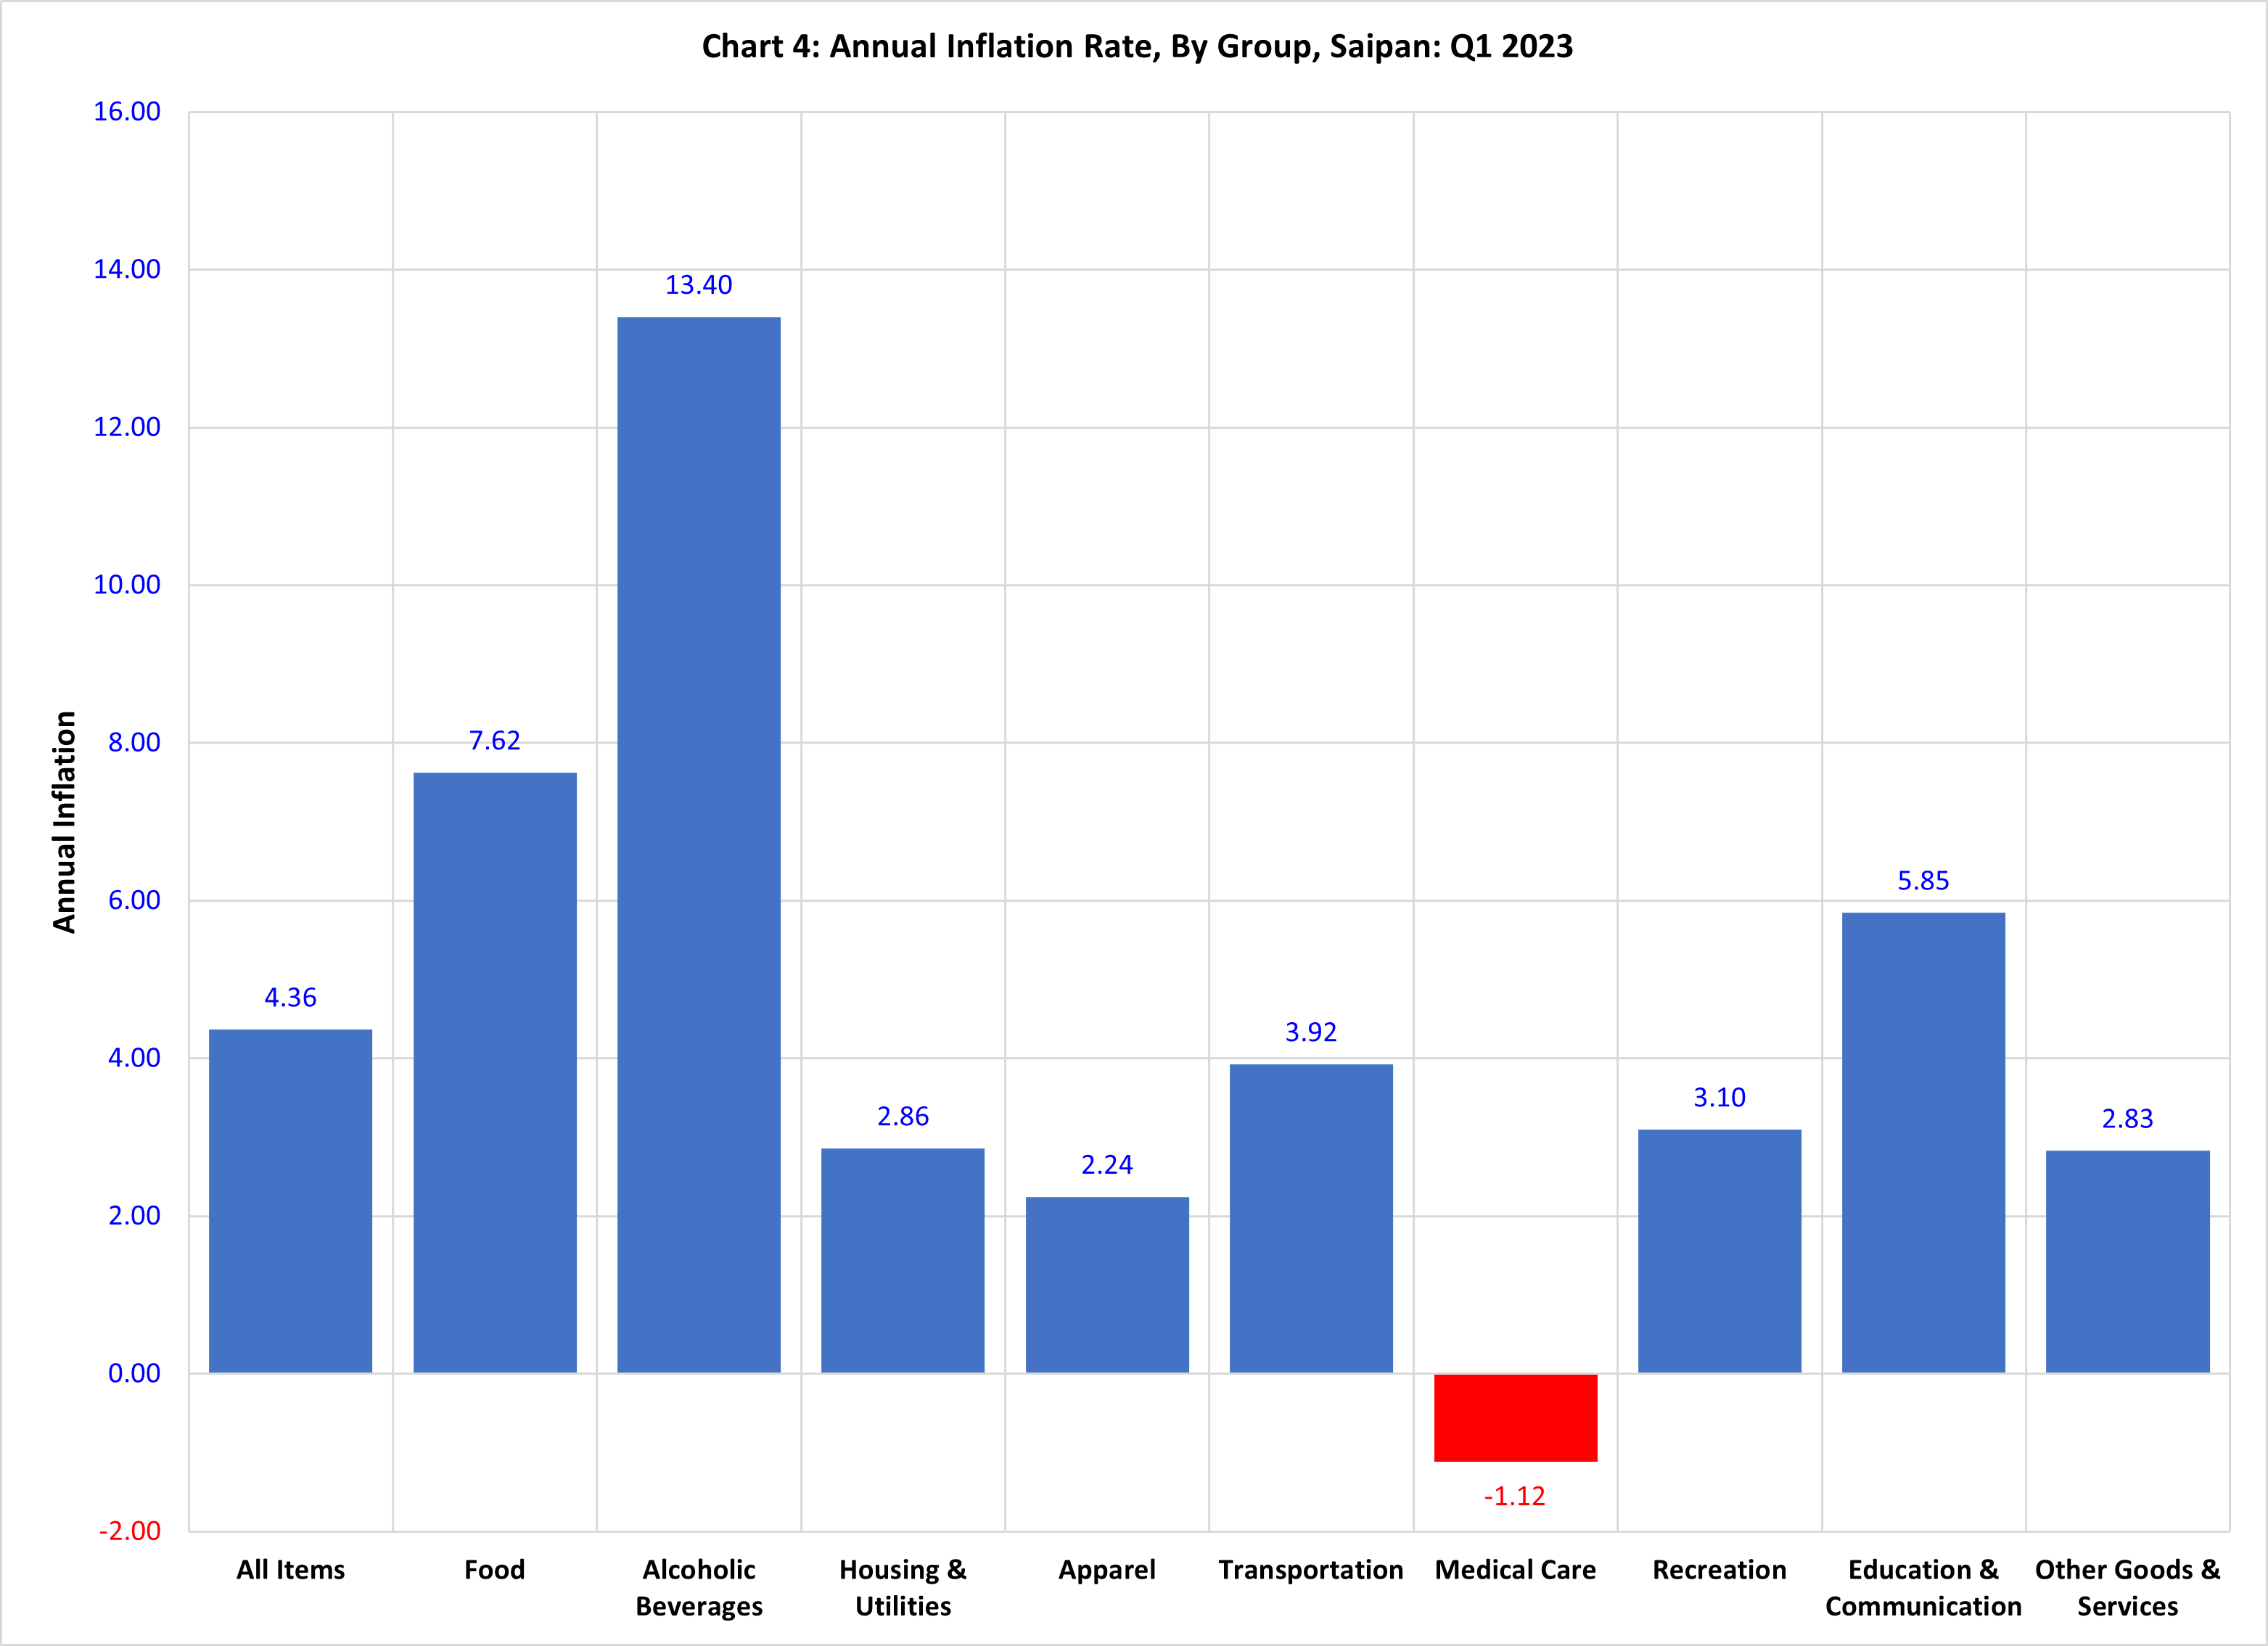
Section 2: Annual Inflation
CNMI CPI Table 2: Annual Inflation, by Group, Saipan
| Year | Quarter | All Items | Food | Alcoholic Beverages | Housing & Utilities | Apparel | Transportation | Medical Care | Recreation | Education & Communication | Other Goods & Services |
|---|---|---|---|---|---|---|---|---|---|---|---|
| Source: CNMI Consumer Price Index | |||||||||||
| 2023 | 1st Qtr | 4.36 | 7.62 | 13.40 | 2.86 | 2.24 | 3.92 | -1.12 | 3.10 | 5.85 | 2.83 |
| 2022 | 4th Qtr | 4.06 | 7.69 | 14.18 | 3.61 | 1.78 | 2.39 | -1.19 | 5.23 | 4.62 | 3.71 |
| 2022 | 3rd Qtr | 4.12 | 7.79 | 8.07 | 3.47 | 1.87 | 2.78 | 0.75 | 4.56 | 3.15 | 4.73 |
| 2022 | 2nd Qtr | 4.41 | 6.58 | 5.18 | 2.71 | 1.74 | 4.72 | 4.96 | 4.21 | 5.87 | 4.24 |
| 2022 | 1st Qtr | 3.10 | 6.10 | 2.62 | 2.99 | 0.49 | 1.48 | 4.50 | 4.30 | 3.41 | 1.25 |
| 2021 | 4th Qtr | 1.91 | 3.48 | 0.22 | 2.47 | 0.36 | 0.40 | 4.18 | 1.44 | 2.72 | 0.36 |
| 2021 | 3rd Qtr | 1.27 | 2.34 | 0.43 | 2.37 | 0.21 | 0.08 | -2.18 | 1.64 | 1.51 | -0.22 |
| 2021 | 2nd Qtr | 0.67 | 0.59 | 0.22 | 1.05 | 0.24 | 0.67 | -1.43 | -0.73 | 1.41 | 0.08 |
| 2021 | 1st Qtr | 0.02 | -0.58 | 0.43 | 0.11 | 0.09 | -0.28 | -2.99 | -0.73 | 3.87 | 2.22 |
| 2020 | 4th Qtr | -0.66 | -0.29 | 0.22 | -0.94 | -0.31 | -1.67 | -3.40 | 1.09 | 2.97 | 2.15 |
| 2020 | 3rd Qtr | -0.71 | -0.08 | 0.00 | -1.10 | -0.27 | -1.32 | 0.86 | -7.16 | 0.53 | 2.42 |
| 2020 | 2nd Qtr | -0.82 | -0.29 | 0.25 | -0.18 | 0.19 | -2.12 | 0.00 | -8.44 | -0.91 | 3.54 |
| 2020 | 1st Qtr | -1.24 | -0.94 | 0.06 | 0.36 | 0.13 | -2.35 | -3.37 | -8.44 | -4.17 | 0.88 |
| 2019 | 4th Qtr | -1.01 | -0.81 | -1.12 | 0.55 | 3.03 | -3.03 | -2.48 | -7.33 | -3.03 | 0.60 |
| 2019 | 3rd Qtr | 1.99 | -0.95 | -0.37 | 0.97 | 1.49 | 6.72 | -2.17 | 0.20 | -0.58 | 2.88 |
| 2019 | 2nd Qtr | 1.63 | -0.32 | -0.62 | 0.83 | -0.03 | 4.84 | -1.96 | 1.59 | 1.57 | 2.79 |
| 2019 | 1st Qtr | 2.80 | 0.48 | -0.44 | 0.25 | 0.10 | 8.57 | 0.82 | 1.81 | 2.49 | 3.10 |
| 2018 | 4th Qtr | 1.80 | 1.55 | 0.76 | -0.75 | -1.57 | 5.03 | 0.67 | -0.49 | 3.98 | 4.42 |
| 2018 | 3rd Qtr | -1.32 | 2.29 | 0.00 | -0.46 | 1.05 | -7.56 | 3.35 | -0.23 | 3.51 | 5.31 |
| 2018 | 2nd Qtr | -1.27 | 1.64 | 0.00 | -0.86 | 1.07 | -5.83 | 1.30 | -0.22 | 1.01 | 4.74 |
| 2018 | 1st Qtr | -1.96 | 1.61 | 0.00 | -0.10 | 3.56 | -9.69 | 1.31 | -0.43 | 1.19 | 7.12 |
| 2017 | 4th Qtr | 2.88 | 1.48 | 0.00 | 14.02 | -0.09 | -3.84 | 1.02 | -0.82 | -0.53 | 7.66 |
| 2017 | 3rd Qtr | 3.44 | 0.49 | 0.00 | 14.01 | -1.14 | -0.37 | -1.92 | -0.65 | -0.18 | 4.14 |
| 2017 | 2nd Qtr | 3.91 | -0.45 | 0.90 | 13.67 | -0.26 | 1.75 | 0.07 | -0.42 | 0.12 | 4.14 |
| 2017 | 1st Qtr | 5.08 | 0.13 | -2.19 | 17.05 | -2.87 | 4.24 | 0.05 | -0.42 | 0.04 | 1.72 |
| 2016 | 4th Qtr | 2.09 | -1.10 | -2.19 | -0.07 | -0.26 | 2.29 | 0.29 | 44.35 | 6.99 | 0.34 |
| 2016 | 3rd Qtr | 1.88 | -0.83 | -2.19 | -0.85 | -0.18 | 1.93 | 0.29 | 44.74 | 6.99 | 0.31 |
| 2016 | 2nd Qtr | 0.12 | 0.06 | -0.54 | -3.61 | -0.12 | -2.92 | 0.29 | 44.30 | 7.10 | 0.03 |
| 2016 | 1st Qtr | -0.31 | -0.34 | 2.61 | -4.67 | 0.04 | -3.58 | 0.29 | 43.92 | 7.15 | -0.08 |
| 2015 | 4th Qtr | -4.07 | 0.76 | 2.61 | -7.53 | 1.24 | -9.55 | 0.00 | -0.53 | 0.15 | 4.36 |
| 2015 | 3rd Qtr | -3.72 | 3.91 | 3.07 | -10.68 | 1.48 | -8.14 | 0.15 | -0.53 | -0.23 | 16.00 |
| 2015 | 2nd Qtr | -2.86 | 4.28 | 0.45 | -9.43 | -0.25 | -5.56 | 0.22 | -2.53 | 0.13 | 15.94 |
| 2015 | 1st Qtr | -2.92 | 5.00 | 1.83 | -10.29 | -0.15 | -5.86 | 0.29 | -0.12 | 0.08 | 15.96 |
| 2014 | 4th Qtr | 1.08 | 6.16 | 2.77 | -4.30 | -0.33 | 3.39 | 0.53 | 0.45 | -1.46 | 11.31 |
| 2014 | 3rd Qtr | 0.40 | 2.66 | 2.31 | -1.22 | -0.68 | 1.13 | 0.38 | 0.31 | -1.09 | -0.02 |
| 2014 | 2nd Qtr | 0.00 | 3.96 | 4.33 | 0.62 | 0.59 | 1.69 | -10.07 | 1.99 | -1.23 | 0.23 |
| 2014 | 1st Qtr | -0.95 | 3.44 | 2.92 | -0.66 | -0.38 | 0.23 | -10.13 | -0.16 | -1.23 | 0.21 |
| 2013 | 4th Qtr | -2.51 | 1.78 | 3.74 | 0.11 | -1.72 | -4.07 | -9.35 | -1.03 | -9.86 | 0.11 |
| 2013 | 3rd Qtr | -1.21 | 1.55 | 3.74 | 2.05 | -3.14 | -1.48 | -7.81 | -0.99 | -9.47 | 0.28 |
| 2013 | 2nd Qtr | 0.10 | 0.27 | 2.22 | 1.28 | -4.82 | -0.23 | 3.82 | -0.76 | -9.27 | 0.09 |
| 2013 | 1st Qtr | -0.53 | 0.24 | 3.71 | 0.61 | -4.60 | -2.92 | 6.00 | -0.80 | -10.25 | 0.28 |
| 2012 | 4th Qtr | 1.07 | -0.04 | 5.45 | 0.46 | -5.42 | 1.98 | 4.76 | 2.40 | -0.28 | 0.43 |
| 2012 | 3rd Qtr | 0.10 | -0.25 | 0.81 | -0.69 | -2.75 | 0.11 | 3.02 | 1.53 | -0.11 | 0.61 |
| 2012 | 2nd Qtr | 2.66 | 1.07 | 0.76 | 1.32 | 0.27 | 0.90 | 15.58 | 1.74 | -0.28 | 0.79 |
| 2012 | 1st Qtr | 4.28 | 3.48 | -0.70 | 2.25 | 0.49 | 5.55 | 13.24 | 1.57 | 0.83 | 0.77 |
| 2011 | 4th Qtr | 2.35 | 5.68 | -3.34 | -4.72 | 1.12 | 4.34 | 13.18 | 0.42 | 0.67 | 6.24 |
| 2011 | 3rd Qtr | 6.34 | 7.53 | 3.78 | -4.30 | 0.01 | 10.48 | 35.74 | 1.11 | -0.30 | 8.03 |
| 2011 | 2nd Qtr | 3.72 | 5.71 | 3.34 | -5.38 | -0.90 | 9.87 | 18.60 | 0.16 | -0.90 | 7.69 |
| 2011 | 1st Qtr | 3.45 | 3.47 | 3.34 | -4.66 | -2.91 | 9.52 | 18.67 | 1.10 | -0.92 | 9.38 |
| 2010 | 4th Qtr | 5.51 | -0.08 | 3.55 | 1.25 | -3.82 | 14.30 | 21.25 | -2.52 | -1.26 | 3.18 |
| 2010 | 3rd Qtr | 4.87 | -1.82 | 0.89 | 9.57 | -3.14 | 10.96 | 1.16 | -2.07 | -0.57 | 1.70 |
| 2010 | 2nd Qtr | 4.84 | 1.03 | 1.34 | 6.44 | 0.22 | 10.15 | -1.08 | -0.77 | 8.34 | 2.80 |
| 2010 | 1st Qtr | 6.04 | 2.02 | 9.82 | 6.83 | 2.77 | 13.10 | -1.16 | 1.61 | 8.19 | 1.02 |
| 2009 | 4th Qtr | 5.39 | 4.47 | 6.51 | 6.64 | 4.30 | 8.42 | -1.57 | 3.77 | 5.82 | 2.97 |
| 2009 | 3rd Qtr | -1.93 | 7.60 | 7.37 | -16.14 | 3.90 | 9.83 | 1.33 | 3.58 | 6.00 | 2.55 |
| 2009 | 2nd Qtr | -3.23 | 9.49 | 10.63 | -16.50 | -0.08 | 4.78 | 1.63 | 2.66 | -1.53 | 9.33 |
| 2009 | 1st Qtr | 6.54 | 8.31 | 2.94 | 9.21 | -1.18 | 4.72 | 1.63 | -3.43 | -1.39 | 9.36 |
| 2008 | 4th Qtr | 5.13 | 11.88 | 7.39 | 3.05 | -1.03 | 4.20 | 7.14 | -1.99 | 1.43 | 7.69 |
| 2008 | 3rd Qtr | 9.60 | 10.19 | 7.00 | 20.28 | -1.55 | -0.08 | 4.01 | -1.72 | 0.93 | 7.69 |
| 2008 | 2nd Qtr | 10.89 | 6.07 | 3.39 | 24.35 | -0.72 | 3.37 | 7.14 | -0.78 | -0.06 | 0.00 |
| 2008 | 1st Qtr | 1.25 | 7.14 | 2.51 | -1.02 | 0.63 | 0.00 | 8.34 | 2.36 | -0.21 | 0.00 |
| 2007 | 4th Qtr | 3.21 | 4.58 | 4.26 | 6.38 | 2.13 | 0.00 | 1.12 | 1.17 | 0.26 | 0.00 |
| 2007 | 3rd Qtr | 3.48 | 5.58 | 3.85 | 6.69 | 2.41 | 0.00 | 1.12 | -0.26 | 0.72 | 0.00 |
| 2007 | 2nd Qtr | 14.63 | 6.33 | 3.88 | 47.62 | 3.16 | 0.00 | 1.12 | 1.40 | 0.85 | 0.00 |
| 2007 | 1st Qtr | 12.51 | 5.04 | 3.90 | 41.15 | 3.39 | 0.00 | 0.00 | 1.87 | 1.01 | 0.00 |
| 2006 | 4th Qtr | 13.36 | 4.43 | 0.56 | 43.00 | 15.42 | 0.33 | 6.47 | 4.16 | 1.16 | 0.00 |
| 2006 | 3rd Qtr | 13.40 | 1.99 | 0.58 | 45.46 | 14.44 | 0.33 | 6.20 | 6.26 | 1.78 | 0.00 |
| 2006 | 2nd Qtr | 2.44 | 1.19 | 0.92 | 5.20 | 9.21 | 0.60 | 6.30 | 3.39 | 3.04 | 0.00 |
| 2006 | 1st Qtr | 2.38 | 1.83 | 2.19 | 4.23 | 7.13 | 0.74 | 6.30 | 5.55 | 3.44 | 0.03 |
| 2005 | 4th Qtr | 1.17 | 0.22 | 1.81 | 2.78 | -0.05 | 0.81 | -0.16 | 3.10 | -0.09 | 0.03 |
| 2005 | 3rd Qtr | 1.25 | 2.72 | 1.52 | 1.05 | -2.51 | 1.01 | 0.09 | 1.93 | 1.05 | 0.03 |
| 2005 | 2nd Qtr | 0.68 | 3.46 | 1.57 | 0.60 | -3.19 | -0.16 | 0.00 | -0.05 | -1.22 | 0.03 |
| 2005 | 1st Qtr | 1.10 | 3.69 | 0.10 | -0.10 | -2.87 | 0.10 | 0.00 | 3.35 | -1.51 | 8.30 |
| 2004 | 4th Qtr | 1.63 | 6.83 | 0.00 | 0.10 | -7.86 | -0.30 | 0.00 | 2.39 | 1.31 | 8.30 |
| 2004 | 3rd Qtr | 0.70 | 4.51 | 0.10 | -1.81 | -5.40 | 0.27 | 0.00 | -0.17 | -1.50 | 8.30 |
| 2004 | 2nd Qtr | 0.98 | 3.80 | -0.48 | -2.30 | -0.38 | 1.20 | 0.00 | 2.22 | -0.20 | 8.30 |
| 2004 | 1st Qtr | 0.20 | 3.10 | -0.10 | -1.70 | 0.90 | 0.50 | 0.00 | -4.40 | -0.50 | 0.00 |
To download, right click on the chart and select “Save Image As”…
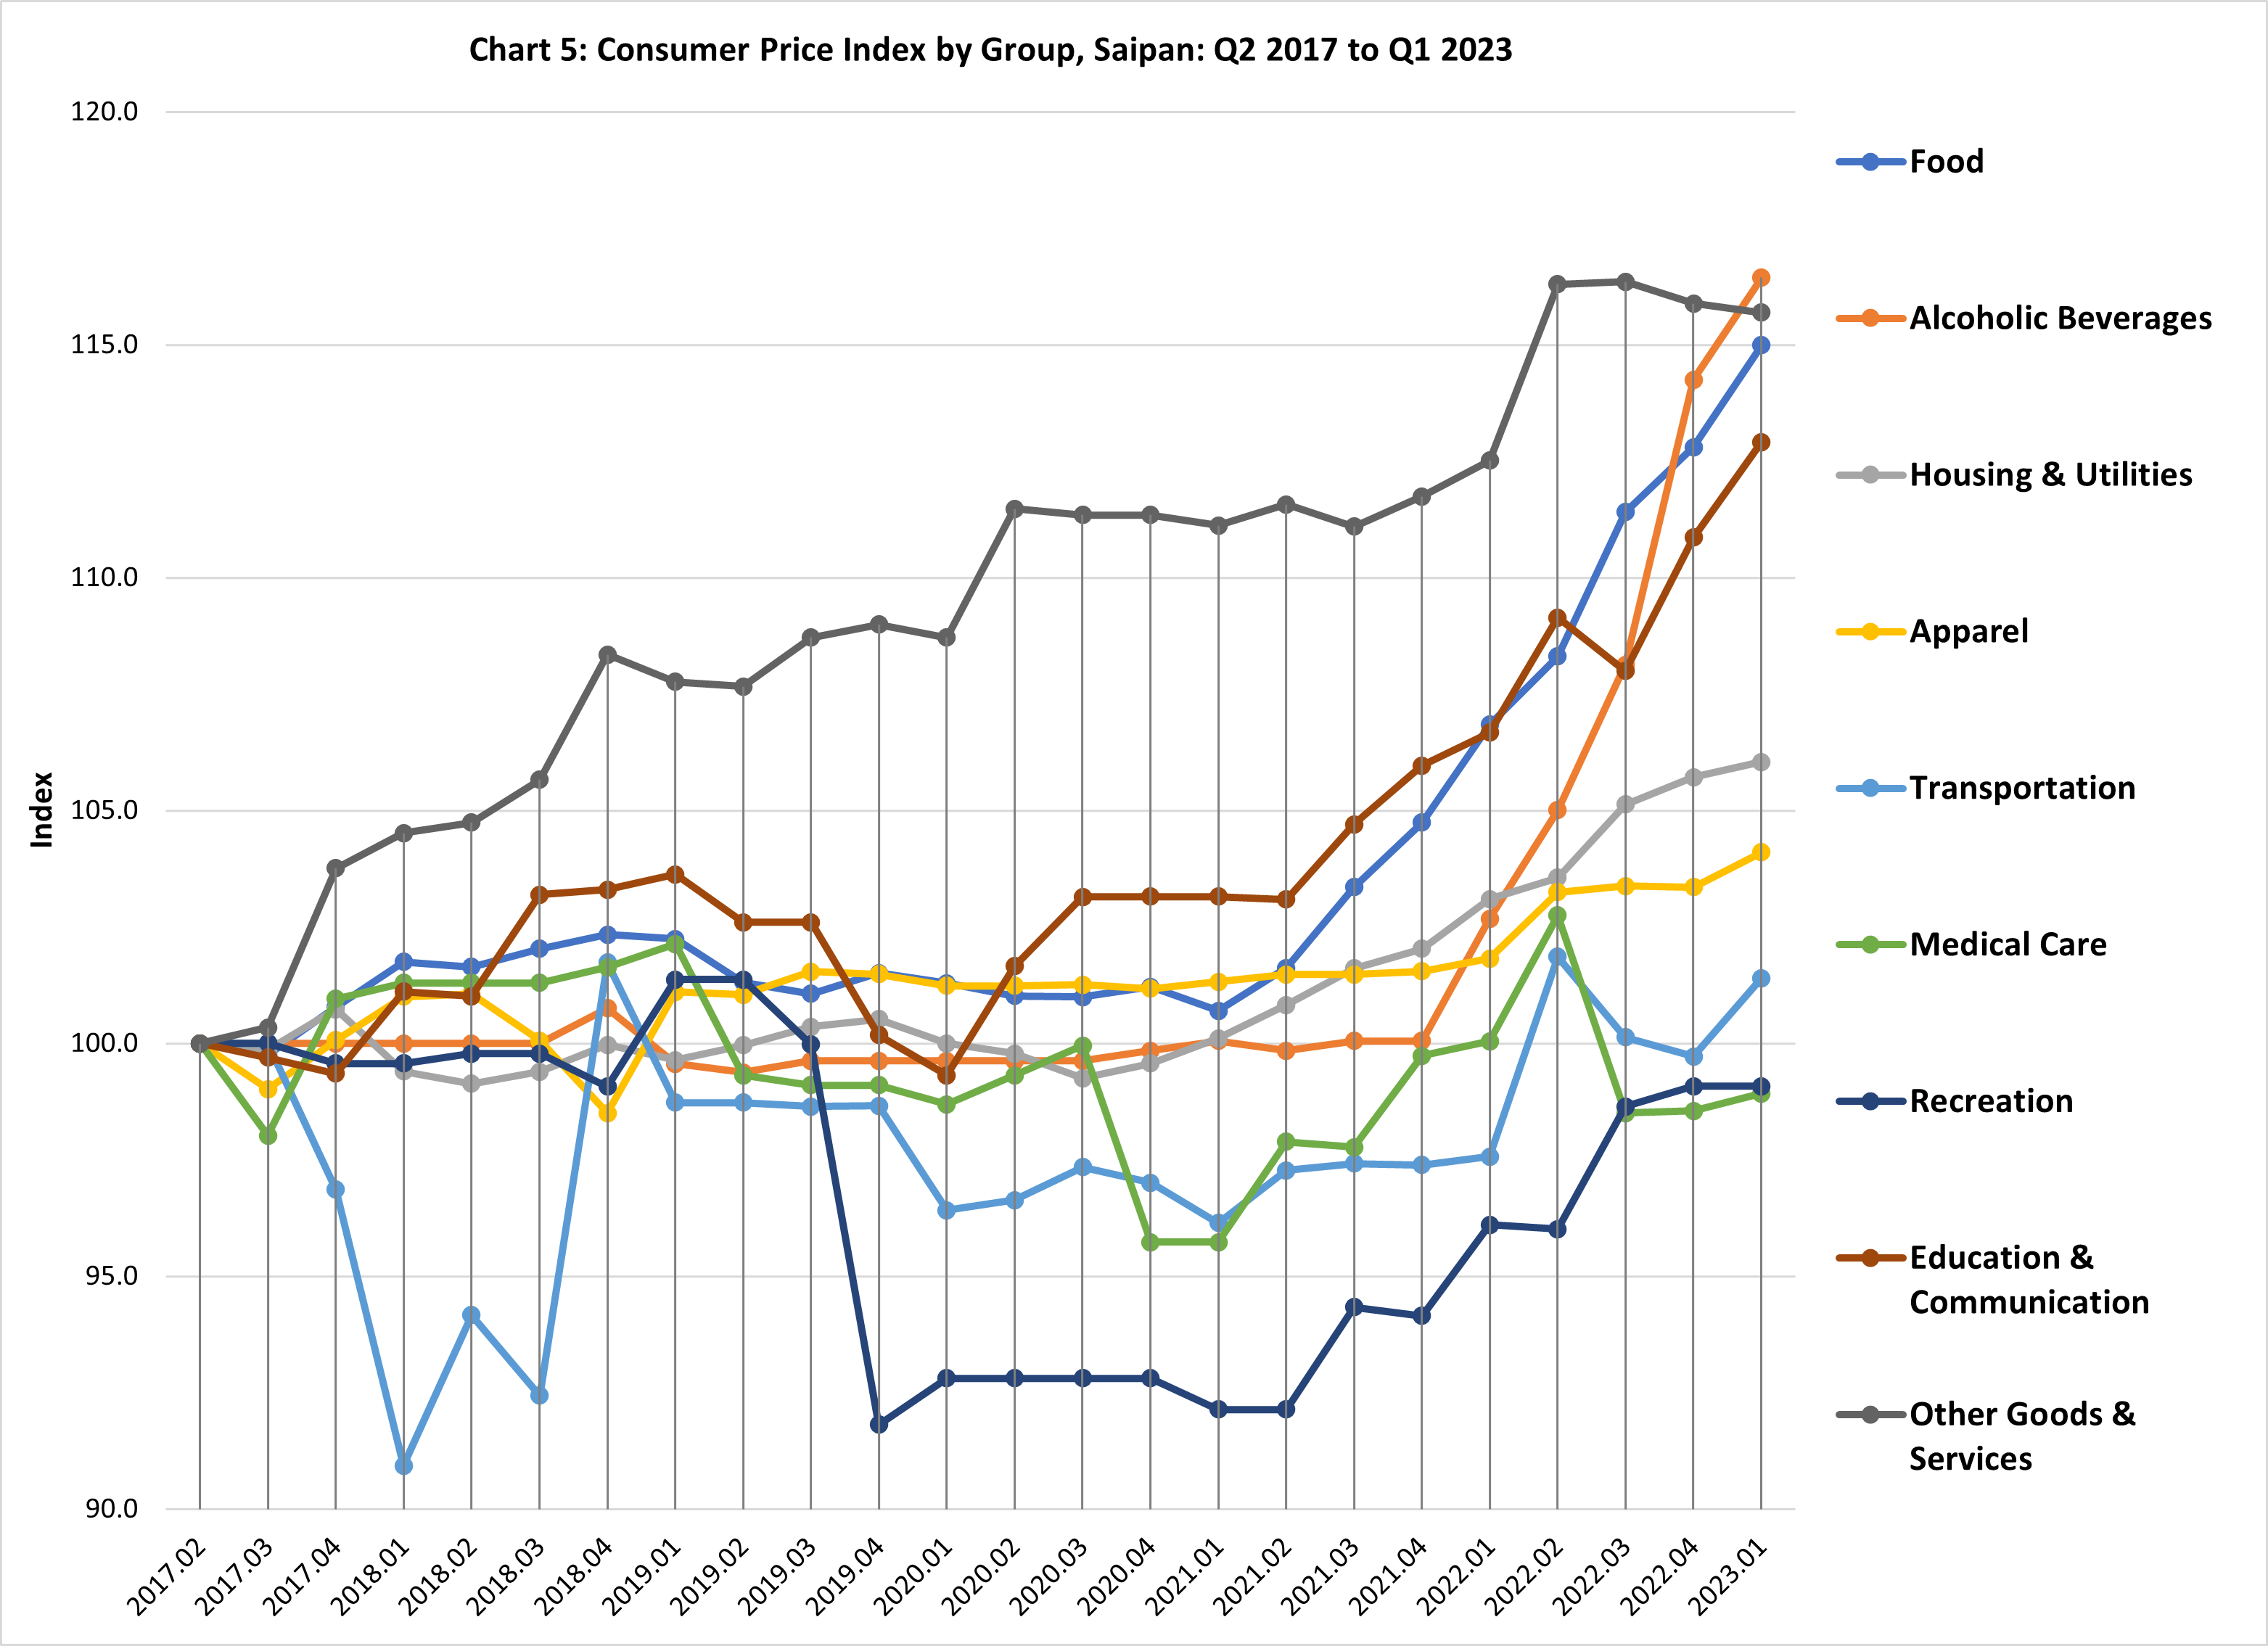
Section 3: Further Analysis of the Index
CNMI CPI Table 3: Consumer Price Index, by Group, Saipan
| Year | Quarter | All Items | Food | Alcoholic Beverages | Housing & Utilities | Apparel | Transportation | Medical Care | Recreation | Education & Communication | Other Goods & Services |
|---|---|---|---|---|---|---|---|---|---|---|---|
| Source: CNMI Consumer Price Index | |||||||||||
| 2023 | 1st Qtr | 106.93 | 114.99 | 116.44 | 106.04 | 104.11 | 101.40 | 98.93 | 99.08 | 112.91 | 115.69 |
| 2022 | 4th Qtr | 105.64 | 112.80 | 114.25 | 105.72 | 103.36 | 99.72 | 98.55 | 99.08 | 110.86 | 115.89 |
| 2022 | 3rd Qtr | 105.11 | 111.41 | 108.13 | 105.13 | 103.38 | 100.13 | 98.50 | 98.64 | 108.00 | 116.35 |
| 2022 | 2nd Qtr | 104.61 | 108.31 | 105.01 | 103.56 | 103.25 | 101.86 | 102.75 | 96.01 | 109.15 | 116.30 |
| 2022 | 1st Qtr | 102.46 | 106.85 | 102.68 | 103.10 | 101.82 | 97.57 | 100.04 | 96.10 | 106.68 | 112.51 |
| 2021 | 4th Qtr | 101.52 | 104.74 | 100.06 | 102.03 | 101.55 | 97.39 | 99.74 | 94.15 | 105.96 | 111.74 |
| 2021 | 3rd Qtr | 100.95 | 103.36 | 100.06 | 101.61 | 101.48 | 97.42 | 97.77 | 94.34 | 104.70 | 111.09 |
| 2021 | 2nd Qtr | 100.19 | 101.62 | 99.84 | 100.83 | 101.48 | 97.27 | 97.89 | 92.14 | 103.09 | 111.57 |
| 2021 | 1st Qtr | 99.38 | 100.70 | 100.06 | 100.11 | 101.32 | 96.15 | 95.73 | 92.14 | 103.16 | 111.12 |
| 2020 | 4th Qtr | 99.62 | 101.22 | 99.84 | 99.57 | 101.18 | 97.01 | 95.73 | 92.81 | 103.16 | 111.34 |
| 2020 | 3rd Qtr | 99.69 | 100.99 | 99.63 | 99.25 | 101.26 | 97.34 | 99.95 | 92.81 | 103.14 | 111.34 |
| 2020 | 2nd Qtr | 99.52 | 101.02 | 99.63 | 99.78 | 101.23 | 96.63 | 99.31 | 92.81 | 101.66 | 111.48 |
| 2020 | 1st Qtr | 99.36 | 101.29 | 99.63 | 100.00 | 101.23 | 96.41 | 98.69 | 92.81 | 99.31 | 108.71 |
| 2019 | 4th Qtr | 100.28 | 101.51 | 99.63 | 100.52 | 101.49 | 98.66 | 99.11 | 91.81 | 100.18 | 109.00 |
| 2019 | 3rd Qtr | 100.41 | 101.07 | 99.63 | 100.36 | 101.54 | 98.64 | 99.11 | 99.97 | 102.60 | 108.71 |
| 2019 | 2nd Qtr | 100.34 | 101.31 | 99.38 | 99.96 | 101.04 | 98.73 | 99.32 | 101.37 | 102.60 | 107.66 |
| 2019 | 1st Qtr | 100.61 | 102.25 | 99.56 | 99.64 | 101.10 | 98.73 | 102.13 | 101.37 | 103.63 | 107.76 |
| 2018 | 4th Qtr | 101.31 | 102.33 | 100.76 | 99.97 | 98.50 | 101.74 | 101.63 | 99.07 | 103.30 | 108.35 |
| 2018 | 3rd Qtr | 98.44 | 102.03 | 100.00 | 99.39 | 100.06 | 92.44 | 101.30 | 99.78 | 103.19 | 105.66 |
| 2018 | 2nd Qtr | 98.73 | 101.64 | 100.00 | 99.14 | 101.07 | 94.17 | 101.30 | 99.78 | 101.01 | 104.74 |
| 2018 | 1st Qtr | 97.87 | 101.75 | 100.00 | 99.40 | 101.01 | 90.94 | 101.30 | 99.57 | 101.11 | 104.52 |
| 2017 | 4th Qtr | 99.51 | 100.78 | 100.00 | 100.73 | 100.07 | 96.86 | 100.95 | 99.57 | 99.35 | 103.76 |
| 2017 | 3rd Qtr | 99.76 | 99.75 | 100.00 | 99.86 | 99.02 | 100.00 | 98.02 | 100.00 | 99.70 | 100.34 |
| 2017 | 2nd Qtr | 100.00 | 100.00 | 100.00 | 100.00 | 100.00 | 100.00 | 100.00 | 100.00 | 100.00 | 100.00 |
| 2017 | 1st Qtr | 99.83 | 100.14 | 100.00 | 99.49 | 97.53 | 100.70 | 99.99 | 100.00 | 99.92 | 97.57 |
| 2016 | 4th Qtr | 96.73 | 99.31 | 100.00 | 88.34 | 100.16 | 100.73 | 99.93 | 100.39 | 99.88 | 96.38 |
| 2016 | 3rd Qtr | 96.44 | 99.27 | 100.00 | 87.59 | 100.15 | 100.37 | 99.93 | 100.66 | 99.88 | 96.35 |
| 2016 | 2nd Qtr | 96.24 | 100.46 | 99.10 | 87.97 | 100.26 | 98.28 | 99.93 | 100.42 | 99.88 | 96.03 |
| 2016 | 1st Qtr | 95.01 | 100.00 | 102.24 | 85.00 | 100.42 | 96.60 | 99.93 | 100.42 | 99.88 | 95.92 |
| 2015 | 4th Qtr | 94.74 | 100.41 | 102.23 | 88.40 | 100.43 | 98.47 | 99.64 | 69.54 | 93.35 | 96.05 |
| 2015 | 3rd Qtr | 94.67 | 100.10 | 102.23 | 88.34 | 100.33 | 98.47 | 99.64 | 69.54 | 93.35 | 96.05 |
| 2015 | 2nd Qtr | 96.13 | 100.40 | 99.64 | 91.26 | 100.38 | 101.24 | 99.64 | 69.59 | 93.25 | 96.00 |
| 2015 | 1st Qtr | 95.30 | 100.34 | 99.64 | 89.16 | 100.38 | 100.19 | 99.64 | 69.78 | 93.21 | 96.00 |
| 2014 | 4th Qtr | 98.76 | 99.65 | 99.64 | 95.60 | 99.20 | 108.87 | 99.64 | 69.92 | 93.21 | 92.04 |
| 2014 | 3rd Qtr | 98.32 | 96.33 | 99.19 | 98.90 | 98.87 | 107.20 | 99.50 | 69.91 | 93.56 | 82.80 |
| 2014 | 2nd Qtr | 98.95 | 96.28 | 99.19 | 100.77 | 100.63 | 107.20 | 99.42 | 71.40 | 93.13 | 82.80 |
| 2014 | 1st Qtr | 98.17 | 95.57 | 97.85 | 99.39 | 100.54 | 106.43 | 99.36 | 69.86 | 93.13 | 82.78 |
| 2013 | 4th Qtr | 97.71 | 93.87 | 96.95 | 99.90 | 99.52 | 105.30 | 99.12 | 69.60 | 94.59 | 82.69 |
| 2013 | 3rd Qtr | 97.93 | 93.83 | 96.95 | 100.12 | 99.55 | 106.00 | 99.12 | 69.70 | 94.59 | 82.82 |
| 2013 | 2nd Qtr | 98.95 | 92.62 | 95.08 | 100.14 | 100.04 | 105.42 | 110.56 | 70.00 | 94.30 | 82.61 |
| 2013 | 1st Qtr | 99.11 | 92.39 | 95.08 | 100.05 | 100.92 | 106.18 | 110.56 | 69.97 | 94.30 | 82.61 |
| 2012 | 4th Qtr | 100.22 | 92.22 | 93.46 | 99.79 | 101.27 | 109.76 | 109.34 | 70.32 | 104.94 | 82.60 |
| 2012 | 3rd Qtr | 99.13 | 92.40 | 93.46 | 98.11 | 102.78 | 107.59 | 107.52 | 70.40 | 104.49 | 82.59 |
| 2012 | 2nd Qtr | 98.85 | 92.37 | 93.01 | 98.88 | 105.10 | 105.67 | 106.49 | 70.54 | 103.94 | 82.54 |
| 2012 | 1st Qtr | 99.64 | 92.17 | 91.67 | 99.45 | 105.79 | 109.37 | 104.30 | 70.54 | 105.07 | 82.38 |
| 2011 | 4th Qtr | 99.16 | 92.26 | 88.63 | 99.32 | 107.07 | 107.63 | 104.37 | 68.67 | 105.23 | 82.24 |
| 2011 | 3rd Qtr | 99.03 | 92.63 | 92.71 | 98.79 | 105.68 | 107.47 | 104.37 | 69.33 | 104.60 | 82.10 |
| 2011 | 2nd Qtr | 96.29 | 91.39 | 92.31 | 97.60 | 104.82 | 104.72 | 92.13 | 69.34 | 104.22 | 81.89 |
| 2011 | 1st Qtr | 95.55 | 89.07 | 92.31 | 97.26 | 105.28 | 103.62 | 92.10 | 69.45 | 104.20 | 81.76 |
| 2010 | 4th Qtr | 96.89 | 87.30 | 91.69 | 104.25 | 105.88 | 103.16 | 92.22 | 68.39 | 104.53 | 77.42 |
| 2010 | 3rd Qtr | 93.12 | 86.14 | 89.33 | 103.23 | 105.67 | 97.28 | 76.89 | 68.57 | 104.92 | 76.00 |
| 2010 | 2nd Qtr | 92.84 | 86.45 | 89.33 | 103.15 | 105.77 | 95.31 | 77.68 | 69.23 | 105.17 | 76.04 |
| 2010 | 1st Qtr | 92.36 | 86.09 | 89.33 | 102.01 | 108.44 | 94.61 | 77.62 | 68.69 | 105.17 | 74.74 |
| 2009 | 4th Qtr | 91.83 | 87.37 | 88.55 | 102.96 | 110.09 | 90.25 | 76.06 | 70.15 | 105.87 | 75.03 |
| 2009 | 3rd Qtr | 88.80 | 87.73 | 88.55 | 94.21 | 109.09 | 87.67 | 76.01 | 70.02 | 105.53 | 74.72 |
| 2009 | 2nd Qtr | 88.55 | 85.58 | 88.15 | 96.90 | 105.54 | 86.52 | 78.52 | 69.77 | 97.07 | 73.97 |
| 2009 | 1st Qtr | 87.09 | 84.38 | 81.34 | 95.49 | 105.51 | 83.65 | 78.52 | 67.60 | 97.21 | 73.99 |
| 2008 | 4th Qtr | 87.13 | 83.63 | 83.13 | 96.55 | 105.55 | 83.24 | 77.27 | 67.60 | 100.05 | 72.87 |
| 2008 | 3rd Qtr | 90.55 | 81.54 | 82.47 | 112.34 | 105.00 | 79.82 | 75.01 | 67.60 | 99.56 | 72.87 |
| 2008 | 2nd Qtr | 91.51 | 78.16 | 79.68 | 116.05 | 105.63 | 82.57 | 77.27 | 67.96 | 98.58 | 67.66 |
| 2008 | 1st Qtr | 81.75 | 77.90 | 79.02 | 87.44 | 106.77 | 79.88 | 77.27 | 70.01 | 98.58 | 67.66 |
| 2007 | 4th Qtr | 82.88 | 74.75 | 77.41 | 93.70 | 106.65 | 79.88 | 72.12 | 68.97 | 98.64 | 67.66 |
| 2007 | 3rd Qtr | 82.62 | 73.99 | 77.07 | 93.40 | 106.65 | 79.88 | 72.12 | 68.79 | 98.64 | 67.66 |
| 2007 | 2nd Qtr | 82.52 | 73.68 | 77.07 | 93.33 | 106.39 | 79.88 | 72.12 | 68.49 | 98.64 | 67.66 |
| 2007 | 1st Qtr | 80.73 | 72.71 | 77.09 | 88.34 | 106.10 | 79.88 | 71.32 | 68.40 | 98.79 | 67.66 |
| 2006 | 4th Qtr | 80.30 | 71.47 | 74.25 | 88.08 | 104.42 | 79.88 | 71.32 | 68.17 | 98.39 | 67.66 |
| 2006 | 3rd Qtr | 79.84 | 70.08 | 74.21 | 87.54 | 104.14 | 79.88 | 71.32 | 68.97 | 97.93 | 67.66 |
| 2006 | 2nd Qtr | 71.99 | 69.30 | 74.19 | 63.22 | 103.14 | 79.88 | 71.32 | 67.54 | 97.81 | 67.66 |
| 2006 | 1st Qtr | 71.76 | 69.22 | 74.19 | 62.59 | 102.62 | 79.88 | 71.32 | 67.14 | 97.80 | 67.66 |
| 2005 | 4th Qtr | 70.84 | 68.44 | 73.84 | 61.59 | 90.47 | 79.62 | 66.99 | 65.45 | 97.26 | 67.66 |
| 2005 | 3rd Qtr | 70.40 | 68.71 | 73.78 | 60.18 | 91.00 | 79.62 | 67.16 | 64.90 | 96.22 | 67.66 |
| 2005 | 2nd Qtr | 70.27 | 68.48 | 73.52 | 60.10 | 94.44 | 79.41 | 67.09 | 65.33 | 94.92 | 67.66 |
| 2005 | 1st Qtr | 70.09 | 67.98 | 72.60 | 60.04 | 95.79 | 79.30 | 67.09 | 63.61 | 94.55 | 67.64 |
| 2004 | 4th Qtr | 70.02 | 68.29 | 72.53 | 59.92 | 90.51 | 78.98 | 67.09 | 63.48 | 97.35 | 67.64 |
| 2004 | 3rd Qtr | 69.53 | 66.90 | 72.67 | 59.56 | 93.35 | 78.83 | 67.09 | 63.67 | 95.22 | 67.64 |
| 2004 | 2nd Qtr | 69.80 | 66.20 | 72.38 | 59.74 | 97.55 | 79.54 | 67.09 | 65.36 | 96.09 | 67.64 |
| 2004 | 1st Qtr | 69.33 | 65.56 | 72.53 | 60.11 | 98.62 | 79.22 | 67.09 | 61.55 | 96.00 | 62.46 |
| 2003 | 4th Qtr | 68.90 | 63.93 | 72.53 | 59.86 | 98.23 | 79.22 | 67.09 | 62.00 | 96.09 | 62.46 |
| 2003 | 3rd Qtr | 69.05 | 64.01 | 72.60 | 60.66 | 98.67 | 78.61 | 67.09 | 63.78 | 96.67 | 62.46 |
| 2003 | 2nd Qtr | 69.12 | 63.78 | 72.73 | 61.15 | 97.92 | 78.59 | 67.09 | 63.94 | 96.28 | 62.46 |
| 2003 | 1st Qtr | 69.19 | 63.59 | 72.60 | 61.15 | 97.75 | 78.83 | 67.09 | 64.38 | 96.48 | 62.46 |
To download, right click on the chart and select “Save Image As”…
CNMI CPI Appendix 1 – Saipan Index
| Year.Qtr | All Items | Food | Alcoholic Beverages |
Housing & Utilities |
Apparel | Transportation | Medical Care |
Recreation | Education & Communication |
Other Goods & Services |
|---|---|---|---|---|---|---|---|---|---|---|
| Source: CNMI Consumer Price Index | ||||||||||
| Weights | 100 | 22.17 | 0.12 | 29.32 | 8.86 | 28 | 2.29 | 1.47 | 5.78 | 2 |
| 2022.04 | 104.46 | 111.59 | 114.49 | 104.68 | 103.06 | 98.66 | 95.97 | 99.08 | 108.04 | 112.66 |
| 2022.03 | 103.93 | 110.49 | 108.35 | 104.11 | 103.22 | 98.75 | 95.92 | 98.64 | 105.41 | 112.95 |
| 2022.02 | 103.49 | 107.47 | 105.23 | 102.72 | 103.09 | 100.52 | 99.73 | 96.01 | 106.57 | 112.89 |
| 2022.01 | 101.42 | 106.08 | 102.89 | 102.26 | 101.67 | 96.37 | 97.33 | 96.1 | 104.25 | 109.26 |
| 2021.04 | 100.52 | 104.02 | 100.27 | 101.33 | 101.39 | 96.18 | 96.99 | 94.15 | 103.54 | 108.54 |
| 2021.03 | 100 | 102.68 | 100.27 | 101.04 | 101.32 | 96.19 | 95.29 | 94.34 | 102.36 | 107.91 |
| 2021.02 | 99.27 | 100.96 | 100.06 | 100.33 | 101.32 | 96.04 | 95.39 | 92.14 | 100.85 | 108.36 |
| 2021.01 | 99.27 | 100.96 | 100.06 | 100.33 | 101.32 | 96.04 | 95.39 | 92.14 | 100.85 | 108.36 |
| 2020.04 | 99.48 | 101.48 | 99.84 | 99.8 | 101.18 | 96.81 | 95.39 | 92.81 | 100.85 | 108.58 |
| 2020.03 | 99.54 | 101.25 | 99.63 | 99.47 | 101.26 | 97.14 | 99.4 | 92.81 | 100.84 | 108.58 |
| 2020.02 | 99.36 | 101.29 | 99.63 | 100 | 101.23 | 96.41 | 98.69 | 92.81 | 99.31 | 108.71 |
| 2020.01 | 99.36 | 101.29 | 99.63 | 100 | 101.23 | 96.41 | 98.69 | 92.81 | 99.31 | 108.71 |
| 2019.04 | 100.28 | 101.51 | 99.63 | 100.52 | 101.49 | 98.66 | 99.11 | 91.81 | 100.18 | 109 |
| 2019.03 | 100.41 | 101.07 | 99.63 | 100.36 | 101.54 | 98.64 | 99.11 | 99.97 | 102.6 | 108.71 |
| 2019.02 | 100.34 | 101.31 | 99.38 | 99.96 | 101.04 | 98.73 | 99.32 | 101.37 | 102.6 | 107.66 |
| 2019.01 | 100.61 | 102.25 | 99.56 | 99.64 | 101.1 | 98.73 | 102.13 | 101.37 | 103.63 | 107.76 |
| 2018.04 | 101.31 | 102.33 | 100.76 | 99.97 | 98.5 | 101.74 | 101.63 | 99.07 | 103.3 | 108.35 |
| 2018.03 | 98.44 | 102.03 | 100 | 99.39 | 100.06 | 92.44 | 101.3 | 99.78 | 103.19 | 105.66 |
| 2018.02 | 98.73 | 101.64 | 100 | 99.14 | 101.07 | 94.17 | 101.3 | 99.78 | 101.01 | 104.74 |
| 2018.01 | 97.87 | 101.75 | 100 | 99.4 | 101.01 | 90.94 | 101.3 | 99.57 | 101.11 | 104.52 |
| 2017.04 | 99.51 | 100.78 | 100 | 100.73 | 100.07 | 96.86 | 100.95 | 99.57 | 99.35 | 103.76 |
| 2017.03 | 99.76 | 99.75 | 100 | 99.86 | 99.02 | 100 | 98.02 | 100 | 99.7 | 100.34 |
| 2017.02 | 100 | 100 | 100 | 100 | 100 | 100 | 100 | 100 | 100 | 100 |
| 2017.01 | 99.83 | 100.14 | 100 | 99.49 | 97.53 | 100.7 | 99.99 | 100 | 99.92 | 97.57 |
| 2016.04 | 96.73 | 99.31 | 100 | 88.34 | 100.16 | 100.73 | 99.93 | 100.39 | 99.88 | 96.38 |
| 2016.03 | 96.44 | 99.27 | 100 | 87.59 | 100.15 | 100.37 | 99.93 | 100.66 | 99.88 | 96.35 |
| 2016.02 | 96.24 | 100.46 | 99.1 | 87.97 | 100.26 | 98.28 | 99.93 | 100.42 | 99.88 | 96.03 |
| 2016.01 | 95.01 | 100 | 102.24 | 85 | 100.42 | 96.6 | 99.93 | 100.42 | 99.88 | 95.92 |
| 2015.04 | 94.74 | 100.41 | 102.23 | 88.4 | 100.43 | 98.47 | 99.64 | 69.54 | 93.35 | 96.05 |
| 2015.03 | 94.67 | 100.1 | 102.23 | 88.34 | 100.33 | 98.47 | 99.64 | 69.54 | 93.35 | 96.05 |
| 2015.02 | 96.13 | 100.4 | 99.64 | 91.26 | 100.38 | 101.24 | 99.64 | 69.59 | 93.25 | 96 |
| 2015.01 | 95.3 | 100.34 | 99.64 | 89.16 | 100.38 | 100.19 | 99.64 | 69.78 | 93.21 | 96 |
| 2014.04 | 98.76 | 99.65 | 99.64 | 95.6 | 99.2 | 108.87 | 99.64 | 69.92 | 93.21 | 92.04 |
| 2014.03 | 98.32 | 96.33 | 99.19 | 98.9 | 98.87 | 107.2 | 99.5 | 69.91 | 93.56 | 82.8 |
| 2014.02 | 98.95 | 96.28 | 99.19 | 100.77 | 100.63 | 107.2 | 99.42 | 71.4 | 93.13 | 82.8 |
| 2014.01 | 98.17 | 95.57 | 97.85 | 99.39 | 100.54 | 106.43 | 99.36 | 69.86 | 93.13 | 82.78 |
| 2013.04 | 97.71 | 93.87 | 96.95 | 99.9 | 99.52 | 105.3 | 99.12 | 69.6 | 94.59 | 82.69 |
| 2013.03 | 97.93 | 93.83 | 96.95 | 100.12 | 99.55 | 106 | 99.12 | 69.7 | 94.59 | 82.82 |
| 2013.02 | 98.95 | 92.62 | 95.08 | 100.14 | 100.04 | 105.42 | 110.56 | 70 | 94.3 | 82.61 |
| 2013.01 | 99.11 | 92.39 | 95.08 | 100.05 | 100.92 | 106.18 | 110.56 | 69.97 | 94.3 | 82.61 |
| 2012.04 | 100.22 | 92.22 | 93.46 | 99.79 | 101.27 | 109.76 | 109.34 | 70.32 | 104.94 | 82.6 |
| 2012.03 | 99.13 | 92.4 | 93.46 | 98.11 | 102.78 | 107.59 | 107.52 | 70.4 | 104.49 | 82.59 |
| 2012.02 | 98.85 | 92.37 | 93.01 | 98.88 | 105.1 | 105.67 | 106.49 | 70.54 | 103.94 | 82.54 |
| 2012.01 | 99.64 | 92.17 | 91.67 | 99.45 | 105.79 | 109.37 | 104.3 | 70.54 | 105.07 | 82.38 |
| 2011.04 | 99.16 | 92.26 | 88.63 | 99.32 | 107.07 | 107.63 | 104.37 | 68.67 | 105.23 | 82.24 |
| 2011.03 | 99.03 | 92.63 | 92.71 | 98.79 | 105.68 | 107.47 | 104.37 | 69.33 | 104.6 | 82.1 |
| 2011.02 | 96.29 | 91.39 | 92.31 | 97.6 | 104.82 | 104.72 | 92.13 | 69.34 | 104.22 | 81.89 |
| 2011.01 | 95.55 | 89.07 | 92.31 | 97.26 | 105.28 | 103.62 | 92.1 | 69.45 | 104.2 | 81.76 |
| 2010.04 | 96.89 | 87.3 | 91.69 | 104.25 | 105.88 | 103.16 | 92.22 | 68.39 | 104.53 | 77.42 |
| 2010.03 | 93.12 | 86.14 | 89.33 | 103.23 | 105.67 | 97.28 | 76.89 | 68.57 | 104.92 | 76 |
| 2010.02 | 92.84 | 86.45 | 89.33 | 103.15 | 105.77 | 95.31 | 77.68 | 69.23 | 105.17 | 76.04 |
| 2010.01 | 92.36 | 86.09 | 89.33 | 102.01 | 108.44 | 94.61 | 77.62 | 68.69 | 105.17 | 74.74 |
| 2009.04 | 91.83 | 87.37 | 88.55 | 102.96 | 110.09 | 90.25 | 76.06 | 70.15 | 105.87 | 75.03 |
| 2009.03 | 88.8 | 87.73 | 88.55 | 94.21 | 109.09 | 87.67 | 76.01 | 70.02 | 105.53 | 74.72 |
| 2009.02 | 88.55 | 85.58 | 88.15 | 96.9 | 105.54 | 86.52 | 78.52 | 69.77 | 97.07 | 73.97 |
| 2009.01 | 87.09 | 84.38 | 81.34 | 95.49 | 105.51 | 83.65 | 78.52 | 67.6 | 97.21 | 73.99 |
| 2008.04 | 87.13 | 83.63 | 83.13 | 96.55 | 105.55 | 83.24 | 77.27 | 67.6 | 100.05 | 72.87 |
| 2008.03 | 90.55 | 81.54 | 82.47 | 112.34 | 105 | 79.82 | 75.01 | 67.6 | 99.56 | 72.87 |
| 2008.02 | 91.51 | 78.16 | 79.68 | 116.05 | 105.63 | 82.57 | 77.27 | 67.96 | 98.58 | 67.66 |
| 2008.01 | 81.75 | 77.9 | 79.02 | 87.44 | 106.77 | 79.88 | 77.27 | 70.01 | 98.58 | 67.66 |
| 2007.04 | 82.88 | 74.75 | 77.41 | 93.7 | 106.65 | 79.88 | 72.12 | 68.97 | 98.64 | 67.66 |
| 2007.03 | 82.62 | 73.99 | 77.07 | 93.4 | 106.65 | 79.88 | 72.12 | 68.79 | 98.64 | 67.66 |
| 2007.02 | 82.52 | 73.68 | 77.07 | 93.33 | 106.39 | 79.88 | 72.12 | 68.49 | 98.64 | 67.66 |
| 2007.01 | 80.73 | 72.71 | 77.09 | 88.34 | 106.1 | 79.88 | 71.32 | 68.4 | 98.79 | 67.66 |
| 2006.04 | 80.3 | 71.47 | 74.25 | 88.08 | 104.42 | 79.88 | 71.32 | 68.17 | 98.39 | 67.66 |
| 2006.03 | 79.84 | 70.08 | 74.21 | 87.54 | 104.14 | 79.88 | 71.32 | 68.97 | 97.93 | 67.66 |
| 2006.02 | 71.99 | 69.3 | 74.19 | 63.22 | 103.14 | 79.88 | 71.32 | 67.54 | 97.81 | 67.66 |
| 2006.01 | 71.76 | 69.22 | 74.19 | 62.59 | 102.62 | 79.88 | 71.32 | 67.14 | 97.8 | 67.66 |
| 2005.04 | 70.84 | 68.44 | 73.84 | 61.59 | 90.47 | 79.62 | 66.99 | 65.45 | 97.26 | 67.66 |
| 2005.03 | 70.4 | 68.71 | 73.78 | 60.18 | 91 | 79.62 | 67.16 | 64.9 | 96.22 | 67.66 |
| 2005.02 | 70.27 | 68.48 | 73.52 | 60.1 | 94.44 | 79.41 | 67.09 | 65.33 | 94.92 | 67.66 |
| 2005.01 | 70.09 | 67.98 | 72.6 | 60.04 | 95.79 | 79.3 | 67.09 | 63.61 | 94.55 | 67.64 |
| 2004.04 | 70.02 | 68.29 | 72.53 | 59.92 | 90.51 | 78.98 | 67.09 | 63.48 | 97.35 | 67.64 |
| 2004.03 | 69.53 | 66.9 | 72.67 | 59.56 | 93.35 | 78.83 | 67.09 | 63.67 | 95.22 | 67.64 |
| 2004.02 | 69.8 | 66.2 | 72.38 | 59.74 | 97.55 | 79.54 | 67.09 | 65.36 | 96.09 | 67.64 |
| 2004.01 | 69.33 | 65.56 | 72.53 | 60.11 | 98.62 | 79.22 | 67.09 | 61.55 | 96 | 62.46 |
| 2003.04 | 68.9 | 63.93 | 72.53 | 59.86 | 98.23 | 79.22 | 67.09 | 62 | 96.09 | 62.46 |
| 2003.03 | 69.05 | 64.01 | 72.6 | 60.66 | 98.67 | 78.61 | 67.09 | 63.78 | 96.67 | 62.46 |
| 2003.02 | 69.12 | 63.78 | 72.73 | 61.15 | 97.92 | 78.59 | 67.09 | 63.94 | 96.28 | 62.46 |
| 2003.01 | 69.19 | 63.59 | 72.6 | 61.15 | 97.75 | 78.83 | 67.09 | 64.38 | 96.48 | 62.46 |
CNMI CPI Appendix 2 – Saipan Quarterly Change
| Year.Qtr [0000.00] |
All Items | Food | Alcoholic Beverages | Housing & Utilities | Apparel | Transportation | Medical Care | Recreation | Education & Communication | Other Goods & Services |
|---|---|---|---|---|---|---|---|---|---|---|
| 2003.01 | – | – | – | – | – | – | – | – | – | – |
| Weights | 100.00 | 22.17 | 0.12 | 29.32 | 8.86 | 28.00 | 2.29 | 1.47 | 5.78 | 2.00 |
| 2023.01 | 1.22 | 1.94 | 1.92 | 0.31 | 0.73 | 1.69 | 0.38 | 0.00 | 1.85 | -0.17 |
| 2022.04 | 0.51 | 1.25 | 5.66 | 0.55 | -0.02 | -0.41 | 0.05 | 0.44 | 2.65 | -0.40 |
| 2022.03 | 0.49 | 2.86 | 2.97 | 1.52 | 0.13 | -1.70 | -4.13 | 2.74 | -1.05 | 0.05 |
| 2022.02 | 2.09 | 1.37 | 2.27 | 0.44 | 1.40 | 4.39 | 2.70 | -0.09 | 2.32 | 3.36 |
| 2022.01 | 0.93 | 2.01 | 2.62 | 1.04 | 0.27 | 0.19 | 0.31 | 2.07 | 0.67 | 0.69 |
| 2021.04 | 0.56 | 1.34 | 0.00 | 0.42 | 0.07 | -0.03 | 2.01 | -0.20 | 1.21 | 0.58 |
| 2021.03 | 0.77 | 1.71 | 0.22 | 0.77 | 0.00 | 0.15 | -0.12 | 2.39 | 1.56 | -0.43 |
| 2021.02 | 0.81 | 0.91 | -0.22 | 0.72 | 0.15 | 1.17 | 2.25 | 0.00 | -0.06 | 0.40 |
| 2021.01 | -0.24 | -0.51 | 0.22 | 0.54 | 0.14 | -0.89 | 0.00 | -0.73 | 0.00 | -0.20 |
| 2020.04 | -0.07 | 0.22 | 0.22 | 0.32 | -0.09 | -0.35 | -4.22 | 0.00 | 0.01 | 0.00 |
| 2020.03 | 0.17 | -0.03 | 0.00 | -0.53 | 0.03 | 0.74 | 0.64 | 0.00 | 1.46 | -0.12 |
| 2020.02 | 0.16 | -0.27 | 0.00 | -0.22 | 0.00 | 0.23 | 0.63 | 0.00 | 2.37 | 2.54 |
| 2020.01 | -0.92 | -0.22 | 0.00 | -0.52 | -0.25 | -2.28 | -0.42 | 1.09 | -0.87 | -0.26 |
| 2019.04 | -0.12 | 0.44 | 0.00 | 0.16 | -0.05 | 0.01 | 0.00 | -8.16 | -2.36 | 0.26 |
| 2019.03 | 0.06 | -0.24 | 0.25 | 0.40 | 0.50 | -0.08 | -0.21 | -1.37 | 0.00 | 0.97 |
| 2019.02 | -0.27 | -0.91 | -0.19 | 0.32 | -0.06 | 0.00 | -2.76 | 0.00 | -1.00 | -0.09 |
| 2019.01 | -0.68 | -0.09 | -1.19 | -0.33 | 2.64 | -2.96 | 0.49 | 2.31 | 0.32 | -0.54 |
| 2018.04 | 2.91 | 0.29 | 0.76 | 0.58 | -1.56 | 10.06 | 0.33 | -0.70 | 0.11 | 2.54 |
| 2018.03 | -0.30 | 0.39 | 0.00 | 0.26 | -1.00 | -1.84 | 0.00 | 0.00 | 2.16 | 0.88 |
| 2018.02 | 0.88 | -0.11 | 0.00 | -0.26 | 0.06 | 3.55 | 0.00 | 0.21 | -0.10 | 0.21 |
| 2018.01 | -1.65 | 0.97 | 0.00 | -1.32 | 0.94 | -6.12 | 0.34 | 0.00 | 1.77 | 0.72 |
| 2017.04 | -0.25 | 1.02 | 0.00 | 0.87 | 1.06 | -3.14 | 2.99 | -0.44 | -0.35 | 3.41 |
| 2017.03 | -0.24 | -0.25 | 0.00 | -0.14 | -0.98 | 0.00 | -1.98 | 0.00 | -0.30 | 0.34 |
| 2017.02 | 0.17 | -0.14 | 0.00 | 0.51 | 2.53 | -0.69 | 0.01 | 0.00 | 0.08 | 2.49 |
| 2017.01 | 3.20 | 0.83 | 0.00 | 12.63 | -2.63 | -0.03 | 0.05 | -0.39 | 0.04 | 1.24 |
| 2016.04 | 0.30 | 0.04 | 0.00 | 0.86 | 0.01 | 0.36 | 0.00 | -0.27 | 0.00 | 0.03 |
| 2016.03 | 0.21 | -1.18 | 0.90 | -0.43 | -0.11 | 2.13 | 0.00 | 0.24 | 0.00 | 0.33 |
| 2016.02 | 1.30 | 0.45 | -3.06 | 3.49 | -0.15 | 1.73 | 0.00 | 0.00 | 0.00 | 0.11 |
| 2016.01 | 0.28 | -0.40 | 0.00 | -3.85 | -0.01 | -1.90 | 0.29 | 44.40 | 6.99 | -0.13 |
| 2015.04 | 0.08 | 0.31 | 0.00 | 0.07 | 0.10 | 0.00 | 0.00 | 0.00 | 0.00 | 0.00 |
| 2015.03 | -1.52 | -0.30 | 2.60 | -3.20 | -0.05 | -2.73 | 0.00 | -0.07 | 0.11 | 0.05 |
| 2015.02 | 0.86 | 0.06 | 0.00 | 2.36 | 0.00 | 1.04 | 0.00 | -0.26 | 0.04 | 0.00 |
| 2015.01 | -3.50 | 0.70 | 0.00 | -6.73 | 1.19 | -7.97 | 0.00 | -0.20 | 0.00 | 4.30 |
| 2014.04 | 0.45 | 3.44 | 0.45 | -3.34 | 0.33 | 1.56 | 0.15 | 0.01 | -0.38 | 11.15 |
| 2014.03 | -0.64 | 0.05 | 0.00 | -1.86 | -1.75 | 0.00 | 0.08 | -2.08 | 0.46 | 0.00 |
| 2014.02 | 0.80 | 0.75 | 1.37 | 1.38 | 0.09 | 0.72 | 0.06 | 2.20 | 0.00 | 0.02 |
| 2014.01 | 0.48 | 1.81 | 0.92 | -0.50 | 1.02 | 1.07 | 0.24 | 0.37 | -1.54 | 0.11 |
| 2013.04 | -0.23 | 0.04 | 0.00 | -0.22 | -0.03 | -0.66 | 0.00 | -0.14 | 0.00 | -0.16 |
| 2013.03 | -1.03 | 1.31 | 1.98 | -0.03 | -0.49 | 0.55 | -10.34 | -0.44 | 0.31 | 0.26 |
| 2013.02 | -0.16 | 0.24 | 0.00 | 0.09 | -0.88 | -0.72 | 0.00 | 0.04 | 0.00 | 0.00 |
| 2013.01 | -1.11 | 0.18 | 1.73 | 0.27 | -0.34 | -3.26 | 1.11 | -0.49 | -10.14 | 0.02 |
| 2012.04 | 1.11 | -0.19 | 0.00 | 1.71 | -1.47 | 2.02 | 1.69 | -0.11 | 0.43 | 0.00 |
| 2012.03 | 0.28 | 0.03 | 0.48 | -0.78 | -2.21 | 1.82 | 0.97 | -0.21 | 0.53 | 0.07 |
| 2012.02 | -0.79 | 0.22 | 1.46 | -0.57 | -0.65 | -3.39 | 2.09 | 0.00 | -1.08 | 0.19 |
| 2012.01 | 0.48 | -0.10 | 3.43 | 0.12 | -1.20 | 1.62 | -0.07 | 2.72 | -0.15 | 0.17 |
| 2011.04 | 0.14 | -0.40 | -4.40 | 0.54 | 1.31 | 0.14 | 0.00 | -0.95 | 0.60 | 0.18 |
| 2011.03 | 2.84 | 1.36 | 0.43 | 1.22 | 0.83 | 2.63 | 13.29 | -0.01 | 0.36 | 0.25 |
| 2011.02 | 0.78 | 2.60 | 0.00 | 0.35 | -0.44 | 1.06 | 0.03 | -0.16 | 0.02 | 0.16 |
| 2011.01 | -1.38 | 2.03 | 0.68 | -6.71 | -0.57 | 0.45 | -0.12 | 1.55 | -0.32 | 5.61 |
| 2010.04 | 4.04 | 1.35 | 2.64 | 0.99 | 0.20 | 6.05 | 19.93 | -0.27 | -0.37 | 1.87 |
| 2010.03 | 0.30 | -0.36 | 0.00 | 0.08 | -0.10 | 2.06 | -1.01 | -0.95 | -0.23 | -0.06 |
| 2010.02 | 0.52 | 0.43 | 0.00 | 1.11 | -2.46 | 0.74 | 0.08 | 0.78 | 0.00 | 1.73 |
| 2010.01 | 0.58 | -1.47 | 0.89 | -0.92 | -1.50 | 4.83 | 2.05 | -2.08 | -0.66 | -0.38 |
| 2009.04 | 3.41 | -0.42 | 0.00 | 9.29 | 0.91 | 2.94 | 0.06 | 0.19 | 0.33 | 0.41 |
| 2009.03 | 0.28 | 2.52 | 0.45 | -2.78 | 3.37 | 1.32 | -3.20 | 0.37 | 8.71 | 1.01 |
| 2009.02 | 1.67 | 1.42 | 8.37 | 1.48 | 0.03 | 3.43 | 0.00 | 3.20 | -0.14 | -0.03 |
| 2009.01 | -0.04 | 0.89 | -2.15 | -1.10 | -0.04 | 0.50 | 1.63 | 0.00 | -2.83 | 1.55 |
| 2008.04 | -3.78 | 2.57 | 0.81 | -14.05 | 0.53 | 4.28 | 3.00 | 0.00 | 0.49 | 0.00 |
| 2008.03 | -1.05 | 4.32 | 3.49 | -3.20 | -0.60 | -3.33 | -2.92 | -0.52 | 0.99 | 7.69 |
| 2008.02 | 11.94 | 0.33 | 0.84 | 32.73 | -1.07 | 3.37 | 0.00 | -2.93 | 0.00 | 0.00 |
| 2008.01 | -1.37 | 4.22 | 2.07 | -6.68 | 0.11 | 0.00 | 7.14 | 1.50 | -0.06 | 0.00 |
| 2007.04 | 0.31 | 1.02 | 0.45 | 0.32 | 0.00 | 0.00 | 0.00 | 0.27 | 0.00 | 0.00 |
| 2007.03 | 0.12 | 0.42 | 0.00 | 0.08 | 0.24 | 0.00 | 0.00 | 0.43 | 0.00 | 0.00 |
| 2007.02 | 2.21 | 1.34 | -0.02 | 5.65 | 0.28 | 0.00 | 1.12 | 0.14 | -0.15 | 0.00 |
| 2007.01 | 0.54 | 1.73 | 3.82 | 0.30 | 1.61 | 0.00 | 0.00 | 0.32 | 0.41 | 0.00 |
| 2006.04 | 0.58 | 1.99 | 0.06 | 0.61 | 0.27 | 0.00 | 0.00 | -1.15 | 0.46 | 0.00 |
| 2006.03 | 10.91 | 1.13 | 0.02 | 38.46 | 0.97 | 0.00 | 0.00 | 2.11 | 0.13 | 0.00 |
| 2006.02 | 0.33 | 0.11 | 0.00 | 1.02 | 0.50 | 0.00 | 0.00 | 0.60 | 0.00 | 0.00 |
| 2006.01 | 1.30 | 1.14 | 0.48 | 1.62 | 13.43 | 0.33 | 6.47 | 2.58 | 0.56 | 0.00 |
| 2005.04 | 0.61 | -0.39 | 0.08 | 2.34 | -0.58 | 0.00 | -0.25 | 0.84 | 1.08 | 0.00 |
| 2005.03 | 0.19 | 0.33 | 0.36 | 0.14 | -3.64 | 0.27 | 0.09 | -0.65 | 1.37 | 0.00 |
| 2005.02 | 0.26 | 0.75 | 1.26 | 0.09 | -1.41 | 0.14 | 0.00 | 2.71 | 0.39 | 0.03 |
| 2005.01 | 0.10 | -0.47 | 0.10 | 0.20 | 5.83 | 0.40 | 0.00 | 0.20 | -2.87 | 0.00 |
| 2004.04 | 0.70 | 2.09 | -0.20 | 0.62 | -3.04 | 0.20 | 0.00 | -0.30 | 2.23 | 0.00 |
| 2004.03 | -0.38 | 1.06 | 0.40 | -0.31 | -4.31 | -0.89 | 0.00 | -2.58 | -0.90 | 0.00 |
| 2004.02 | 0.68 | 0.97 | -0.20 | -0.61 | -1.09 | 0.40 | 0.00 | 6.20 | 0.10 | 8.30 |
| 2004.01 | 0.63 | 2.55 | 0.00 | 0.41 | 0.40 | 0.00 | 0.00 | -0.73 | -0.10 | 0.00 |
| 2003.04 | -0.22 | -0.13 | -0.10 | -1.31 | -0.45 | 0.77 | 0.00 | -2.79 | -0.60 | 0.00 |
| 2003.03 | -0.10 | 0.37 | -0.18 | -0.80 | 0.77 | 0.03 | 0.00 | -0.26 | 0.40 | 0.00 |
| 2003.02 | -0.10 | 0.29 | 0.18 | 0.00 | 0.18 | -0.30 | 0.00 | -0.68 | -0.20 | 0.00 |
CNMI CPI Appendix 3 – CPI Weights for each Island
| Group | Item | Saipan | Tinian | Rota |
|---|---|---|---|---|
| Source: CNMI Consumer Price Index | ||||
| Food | Food | 22.17 | 36.24 | 19.55 |
| Food | Cereal Products | 4.39 | 6.62 | 5.19 |
| Food | Meat Products | 4.71 | 11.42 | 1.95 |
| Food | Seafood Produce | 1.60 | 3.60 | 1.89 |
| Food | Dairy Produce | 1.41 | 2.91 | 1.51 |
| Food | Fruit | 0.85 | 1.65 | 0.15 |
| Food | Vegetables | 0.87 | 3.00 | 3.91 |
| Food | Non-alcoholic Beverages | 1.94 | 1.97 | 1.85 |
| Food | Confectionery | 0.27 | 0.60 | N/A |
| Food | Miscellaneous Food | 1.76 | 2.07 | 1.93 |
| Food | Take-away Food | 4.37 | 2.39 | 1.17 |
| Alcoholic Beverages | Alcoholic Beverages | 0.12 | 0.71 | 0.57 |
| Alcoholic Beverages | Alcoholic Beverages | 0.12 | 0.71 | 0.57 |
| Housing & Utilities | Housing & Utilities | 29.32 | 20.67 | 6.84 |
| Housing & Utilities | Housing | 3.86 | 3.19 | 2.74 |
| Housing & Utilities | Utilities | 5.45 | 6.15 | 3.53 |
| Housing & Utilities | Household Goods/Furniture | 15.15 | 3.55 | 0.58 |
| Housing & Utilities | Household Maintenance | 4.86 | 7.79 | N/A |
| Apparel | Apparel | 8.86 | 8.96 | 1.45 |
| Apparel | Mens Clothing | 3.00 | 3.39 | 1.08 |
| Apparel | Womens Clothing | 2.38 | 2.13 | N/A |
| Apparel | Infant Clothing | 0.49 | 0.57 | 0.31 |
| Apparel | Footwear | 2.52 | 2.87 | 0.05 |
| Apparel | Accessories | 0.47 | N/A | N/A |
| Transportation | Transportation | 28.00 | 10.90 | 5.24 |
| Transportation | Vehicle Purchase | 19.35 | N/A | N/A |
| Transportation | Vehicle Maintenance | 8.65 | 10.90 | 5.24 |
| Transportation | Public Transport | N/A | N/A | N/A |
| Medical Care | Medical Care | 2.29 | 6.89 | 0.23 |
| Medical Care | Medical Supplies | 1.38 | 3.58 | 0.23 |
| Medical Care | Medical Services | 0.91 | 3.31 | N/A |
| Recreation | Recreation | 1.47 | 4.65 | 2.34 |
| Recreation | Recreation | 1.47 | 4.65 | 2.34 |
| Education & Communication | Education & Communication | 5.78 | 9.69 | 48.22 |
| Education & Communication | Education | 4.17 | 5.56 | 20.66 |
| Education & Communication | Communication | 1.60 | 4.13 | 27.56 |
| Other Goods & Services | Other Goods & Services | 2.00 | 1.31 | 15.55 |
| Other Goods & Services | Cigarettes & BetelNut | 0.38 | 0.30 | 5.07 |
| Other Goods & Services | Other Goods | 0.72 | N/A | 3.09 |
| Other Goods & Services | Other Services | 0.90 | 1.00 | 7.39 |