IntroTable DataCharts and Figures Data
Economic Indicator
Economic Indicator (EI) Data as it relates to Auto Sales by Vehicle Type, quarters 1 through 4. Auto Sales Annual Reports are reflected off the 4th Quarter of their respected Year
Economic Indicator
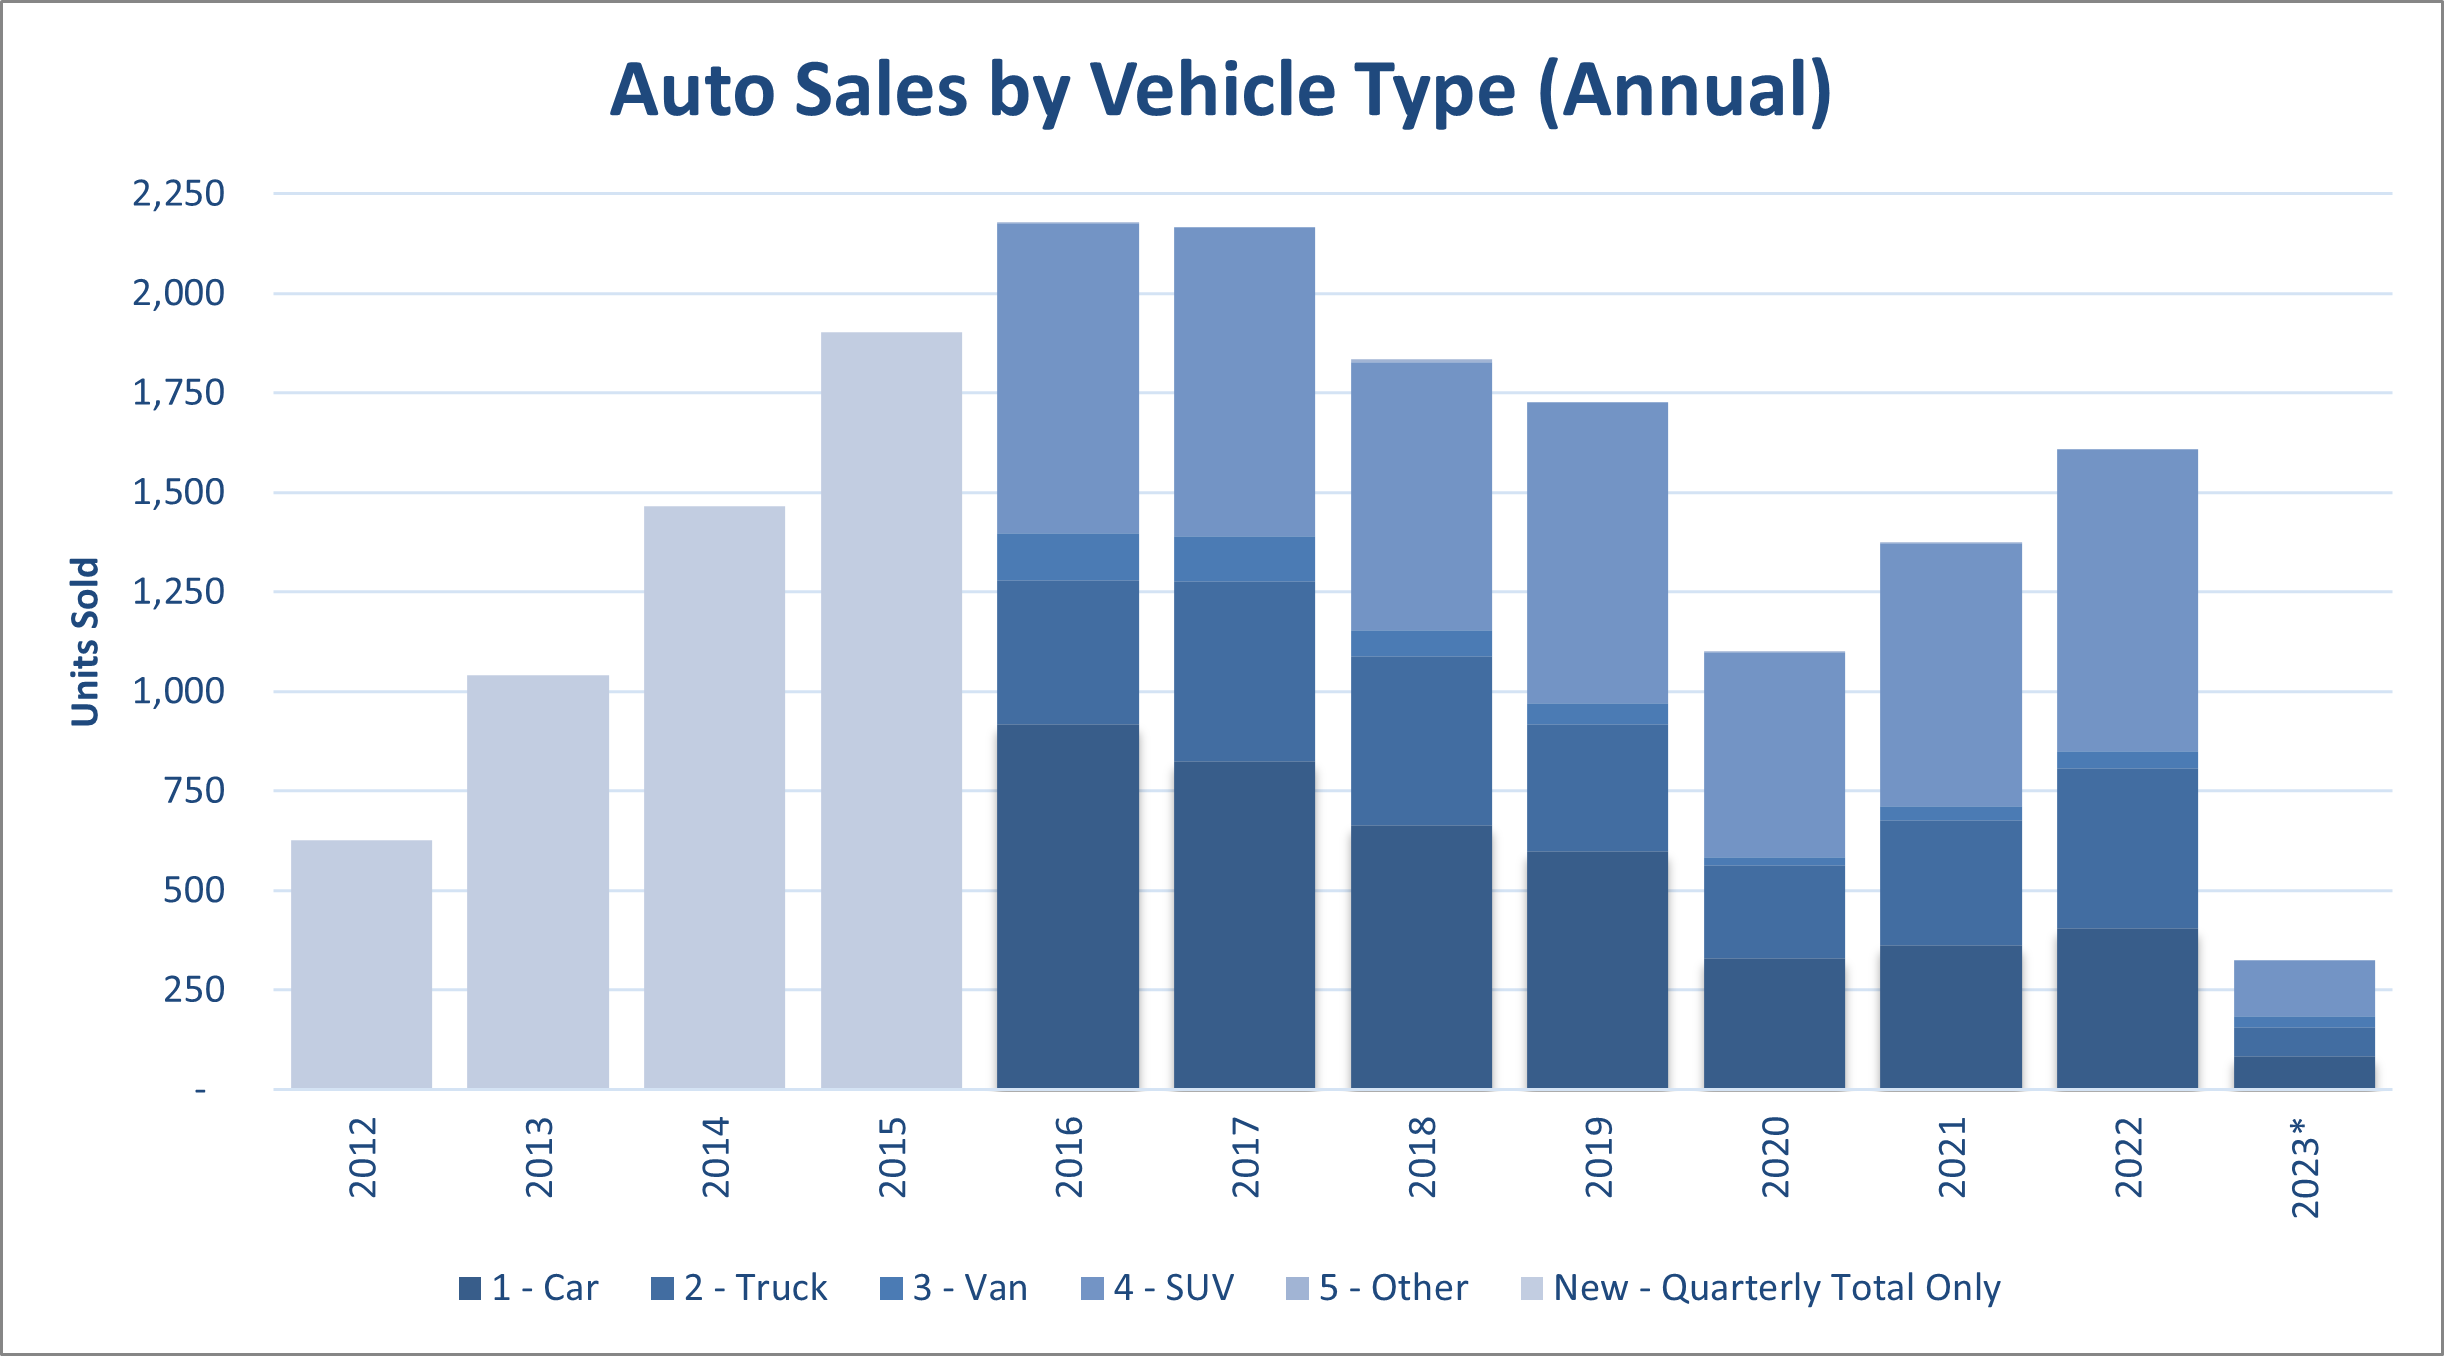
Auto Sales by Vehicle Type (Annual)
Annual Auto Sales by Vehicle Type Economic Indicator
Source: Commonwealth Auto Dealer’s Association (CADA)
| Total Units Sold (New_ | % Change From Previous Year | Quarterly Total Only | Car | Truck | Van | SUV | Other | |
|---|---|---|---|---|---|---|---|---|
| Source: CNMI Economic Indicators / CSD | ||||||||
| 2023* | 326 | -79.75% | 84 | 72 | 28 | 142 | 0 | |
| 2022 | 1,610 | 17.18% | 406 | 401 | 44 | 759 | 0 | |
| 2021 | 1,374 | 24.68% | 364 | 313 | 36 | 659 | 2 | |
| 2020 | 1,102 | -36.19% | 331 | 232 | 20 | 516 | 3 | |
| 2019 | 1,727 | -5.94% | 598 | 319 | 54 | 756 | 0 | |
| 2018 | 1,836 | -15.24% | 664 | 426 | 64 | 674 | 8 | |
| 2017 | 2,166 | -0.51% | 825 | 452 | 114 | 775 | 0 | |
| 2016 | 2,177 | 14.46% | 917 | 363 | 117 | 779 | 1 | |
| 2015 | 1,902 | 29.83% | 1,902 | |||||
| 2014 | 1,465 | 40.73% | 1,465 | |||||
| 2013 | 1,041 | 66.29% | 1,041 | |||||
| 2012 | 626 | 37.89% | 626 | |||||
| 2011 | 454 | -24.58% | 454 | |||||
| 2010 | 602 | 28.36% | 602 | |||||
| 2009 | 469 | -21.18% | 469 | |||||
| 2008 | 595 | -5.85% | 595 | |||||
| 2007 | 632 | -36.80% | 632 |
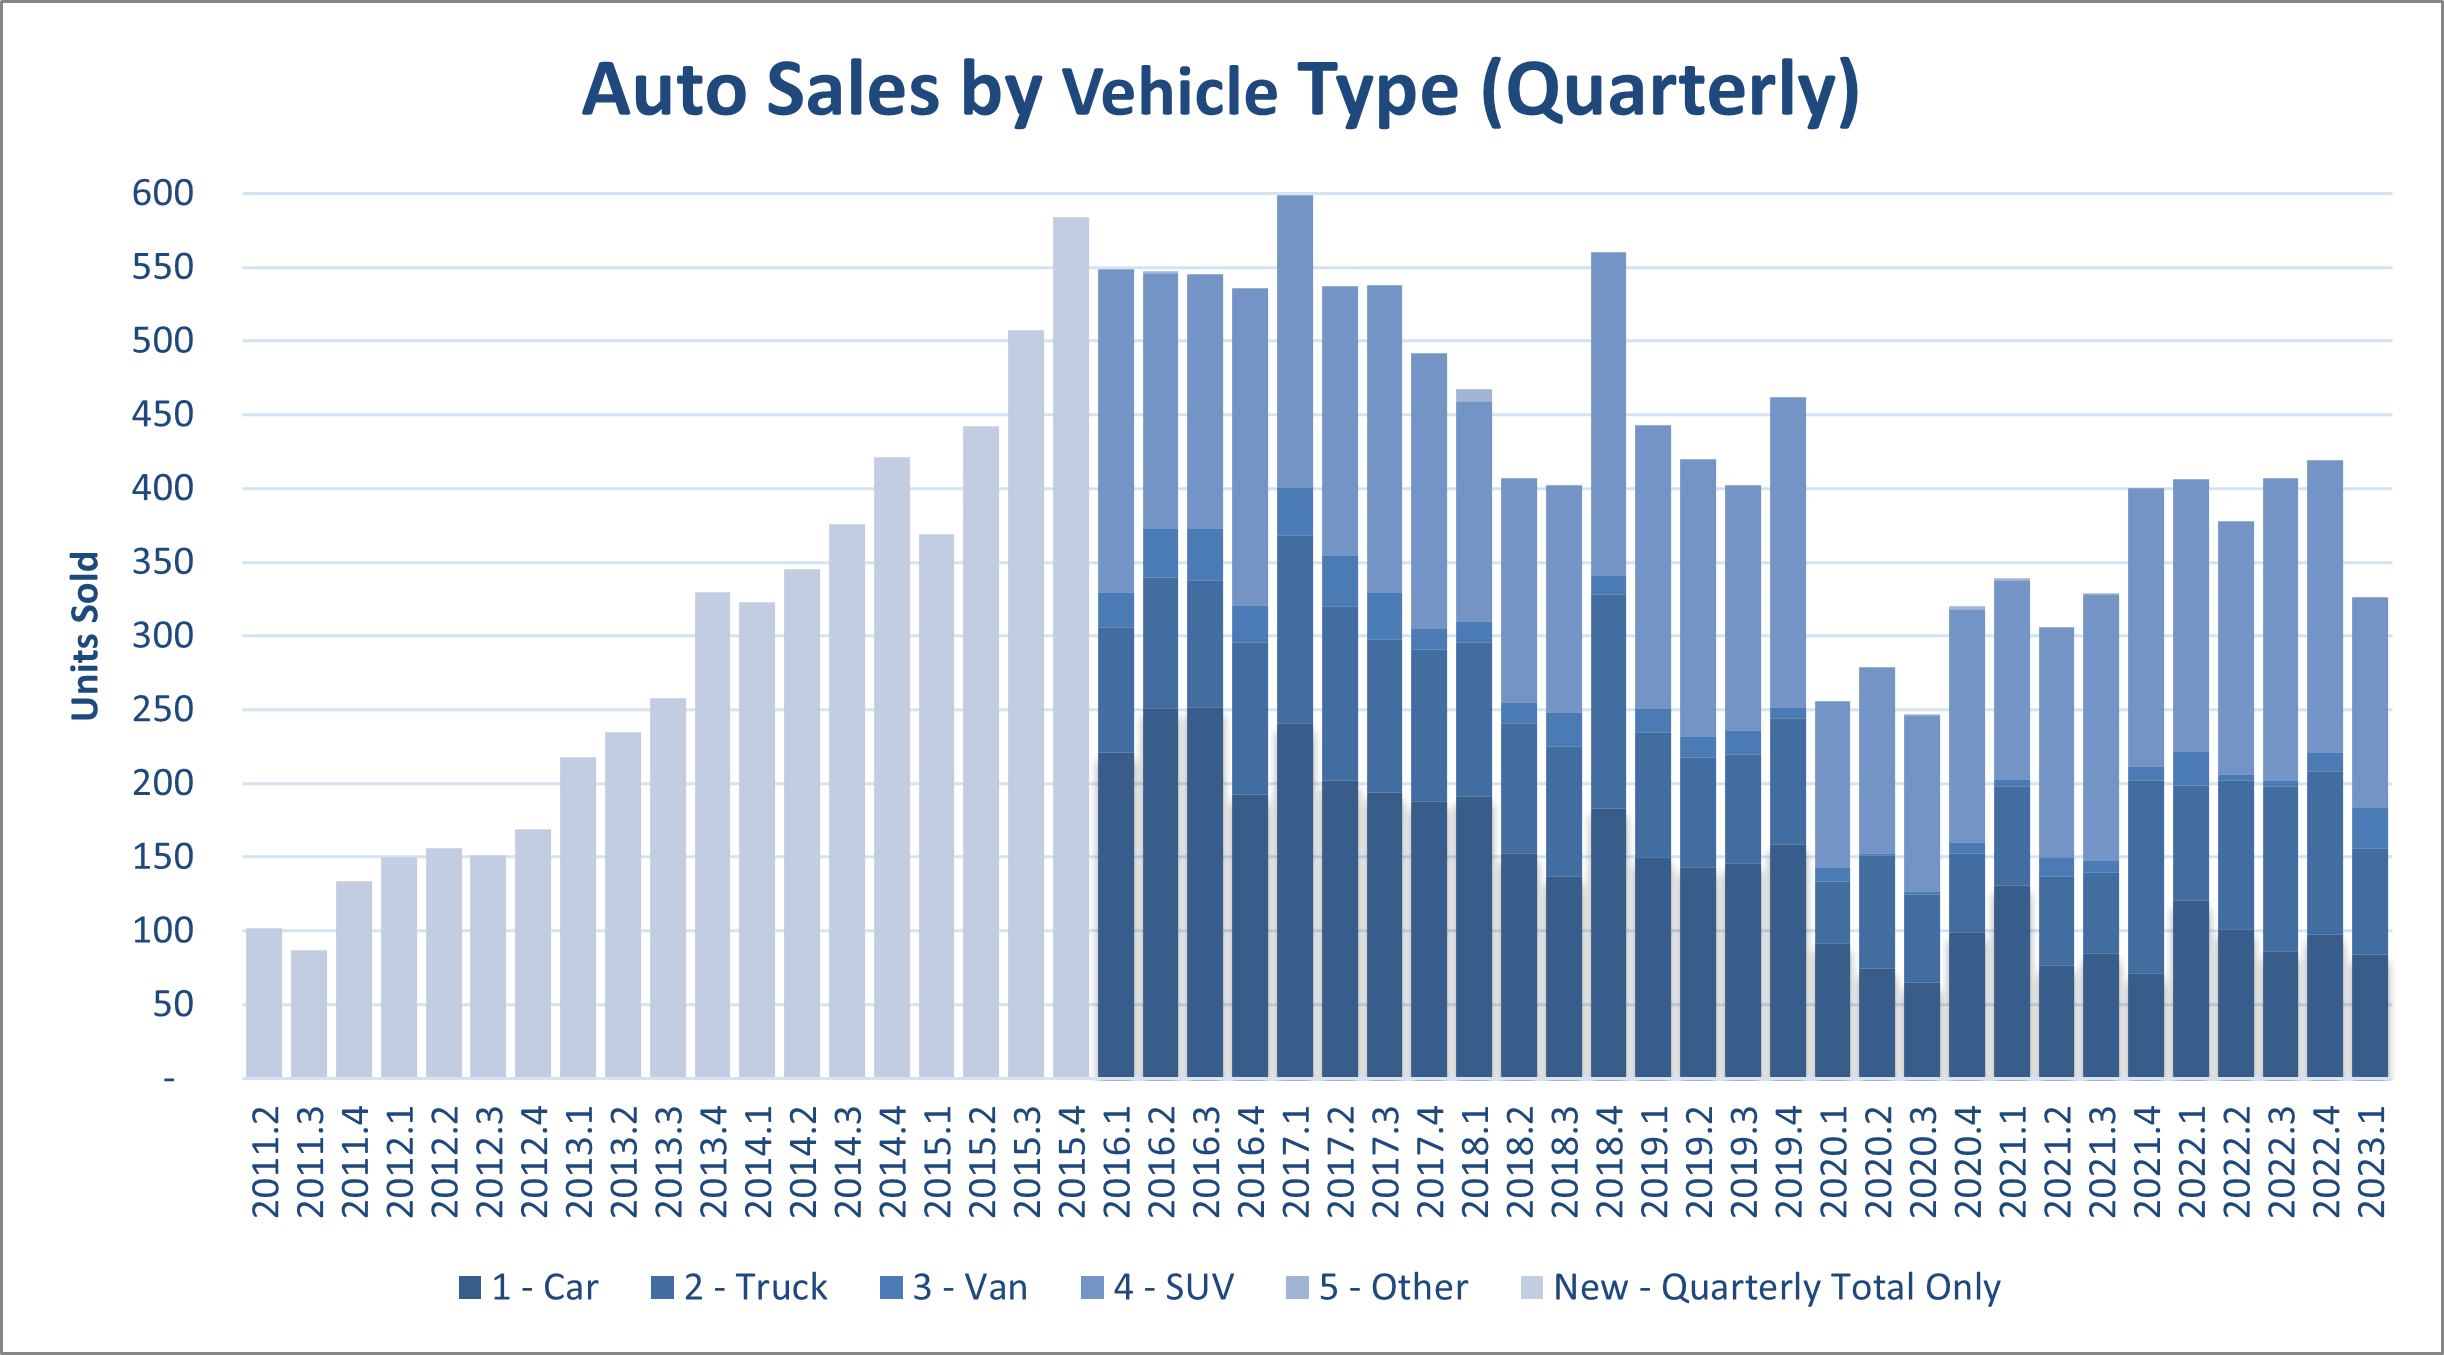
Auto Sales by Vehicle Type (Quarterly)
Quarterly Auto Sales by Vehicle Type Economic Indicator
Source: Commonwealth Auto Dealer’s Association (CADA)
| Total Units Sold (New) | % Change From Previous Quarter | Quarterly Total Only | Car | Truck | Van | SUV | Other | |
|---|---|---|---|---|---|---|---|---|
| Source: CNMI Economic Indicators / CSD | ||||||||
| 2023.1 | 326 | -22.20% | 84 | 72 | 28 | 142 | 0 | |
| 2022.4 | 419 | 2.95% | 98 | 110 | 13 | 198 | 0 | |
| 2022.3 | 407 | 7.67% | 86 | 112 | 4 | 205 | 0 | |
| 2022.2 | 378 | -6.90% | 101 | 101 | 4 | 172 | 0 | |
| 2022.1 | 406 | 1.50% | 121 | 78 | 23 | 184 | 0 | |
| 2021.4 | 400 | 21.58% | 71 | 131 | 10 | 188 | 0 | |
| 2021.3 | 329 | 7.52% | 85 | 55 | 8 | 180 | 1 | |
| 2021.2 | 306 | -9.73% | 77 | 60 | 13 | 156 | 0 | |
| 2021.1 | 339 | 5.94% | 131 | 67 | 5 | 135 | 1 | |
| 2020.4 | 320 | 29.55% | 99 | 54 | 7 | 158 | 2 | |
| 2020.3 | 247 | -11.47% | 65 | 60 | 2 | 119 | 1 | |
| 2020.2 | 279 | 8.98% | 75 | 76 | 2 | 126 | 0 | |
| 2020.1 | 256 | -44.59% | 92 | 42 | 9 | 113 | 0 | |
| 2019.4 | 462 | 14.93% | 159 | 85 | 8 | 210 | 0 | |
| 2019.3 | 402 | -4.29% | 146 | 74 | 16 | 166 | 0 | |
| 2019.2 | 420 | -5.19% | 143 | 75 | 14 | 188 | 0 | |
| 2019.1 | 443 | -20.89% | 150 | 85 | 16 | 192 | 0 | |
| 2018.4 | 560 | 39.30% | 183 | 145 | 13 | 219 | 0 | |
| 2018.3 | 402 | -1.23% | 137 | 88 | 23 | 154 | 0 | |
| 2018.2 | 407 | -12.85% | 153 | 88 | 14 | 152 | 0 | |
| 2018.1 | 467 | -5.08% | 191 | 105 | 14 | 149 | 8 | |
| 2017.4 | 492 | -8.55% | 188 | 103 | 14 | 187 | 0 | |
| 2017.3 | 538 | 0.19% | 194 | 104 | 32 | 208 | 0 | |
| 2017.2 | 537 | -10.35% | 202 | 118 | 35 | 182 | 0 | |
| 2017.1 | 599 | 11.75% | 241 | 127 | 33 | 198 | 0 | |
| 2016.4 | 536 | -1.65% | 193 | 103 | 25 | 215 | 0 | |
| 2016.3 | 545 | -0.37% | 252 | 86 | 35 | 172 | 0 | |
| 2016.2 | 547 | -0.36% | 251 | 89 | 33 | 173 | 1 | |
| 2016.1 | 549 | -5.99% | 221 | 85 | 24 | 219 | 0 | |
| 2015.4 | 584 | 15.19% | 584 | |||||
| 2015.3 | 507 | 14.71% | 507 | |||||
| 2015.2 | 442 | 19.78% | 442 | |||||
| 2015.1 | 369 | -12.35% | 369 | |||||
| 2014.4 | 421 | 11.97% | 421 | |||||
| 2014.3 | 376 | 8.99% | 376 | |||||
| 2014.2 | 345 | 6.81% | 345 | |||||
| 2014.1 | 323 | -2.12% | 323 | |||||
| 2013.4 | 330 | 27.91% | 330 | |||||
| 2013.3 | 258 | 9.79% | 258 | |||||
| 2013.2 | 235 | 7.80% | 235 | |||||
| 2013.1 | 218 | 28.99% | 218 | |||||
| 2012.4 | 169 | 11.92% | 169 | |||||
| 2012.3 | 151 | -3.21% | 151 | |||||
| 2012.2 | 156 | 4.00% | 156 | |||||
| 2012.1 | 150 | 11.94% | 150 | |||||
| 2011.4 | 134 | 54.02% | 134 | |||||
| 2011.3 | 87 | -14.71% | 87 | |||||
| 2011.2 | 102 | -22.14% | 102 | |||||
| 2011.1 | 131 | -5.76% | 131 | |||||
| 2010.4 | 139 | -9.15% | 139 | |||||
| 2010.3 | 153 | 19.53% | 153 | |||||
| 2010.2 | 128 | -29.67% | 128 | |||||
| 2010.1 | 182 | 35.82% | 182 | |||||
| 2009.4 | 134 | -3.60% | 134 | |||||
| 2009.3 | 139 | 37.62% | 139 | |||||
| 2009.2 | 101 | 6.32% | 101 | |||||
| 2009.1 | 95 | 0.00% | 95 | |||||
| 2008.4 | 95 | -38.71% | 95 | |||||
| 2008.3 | 155 | 0.00% | 155 | |||||
| 2008.2 | 155 | -18.42% | 155 | |||||
| 2008.1 | 190 | 38.69% | 190 | |||||
| 2007.4 | 137 | -12.74% | 137 | |||||
| 2007.3 | 157 | 0.00% | 157 | |||||
| 2007.2 | 157 | -13.26% | 157 | |||||
| 2007.1 | 181 | 4.02% | 181 |
Economic Indicator
To download, right click on the chart and select “Save Image As”…