Economic Indicator
Economic Indicator (EI) Data as it relates to Building Permits & Project Costs, quarters 1 through 4. Building Permits & Project Costs Annual Reports are reflected off the 4th Quarter of their respected Year
Economic Indicator
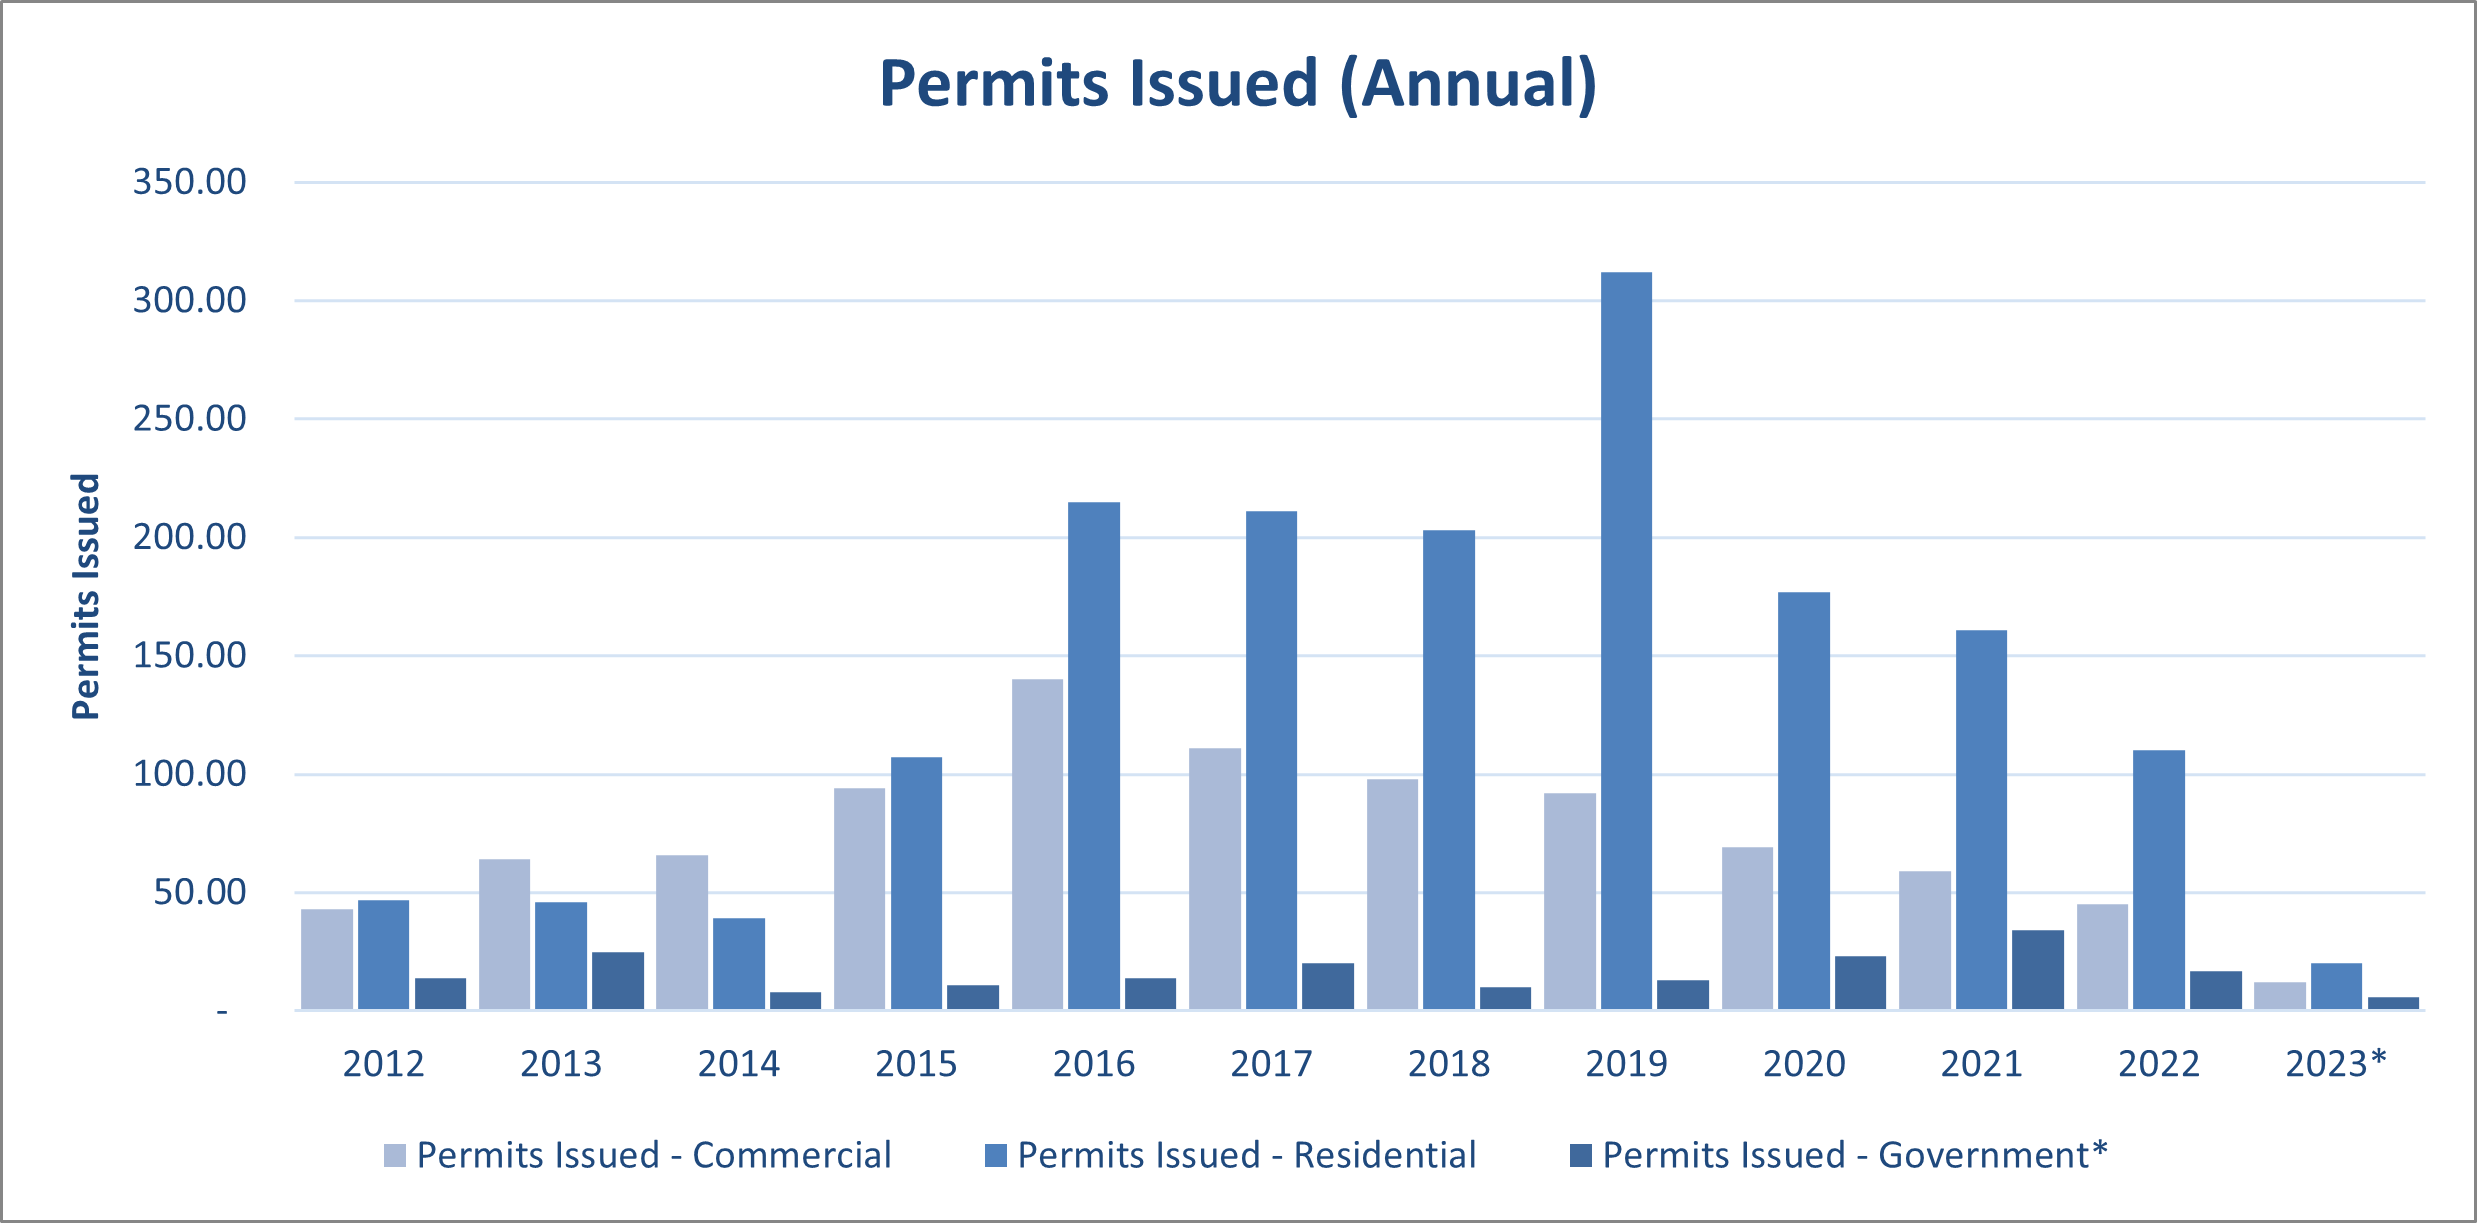
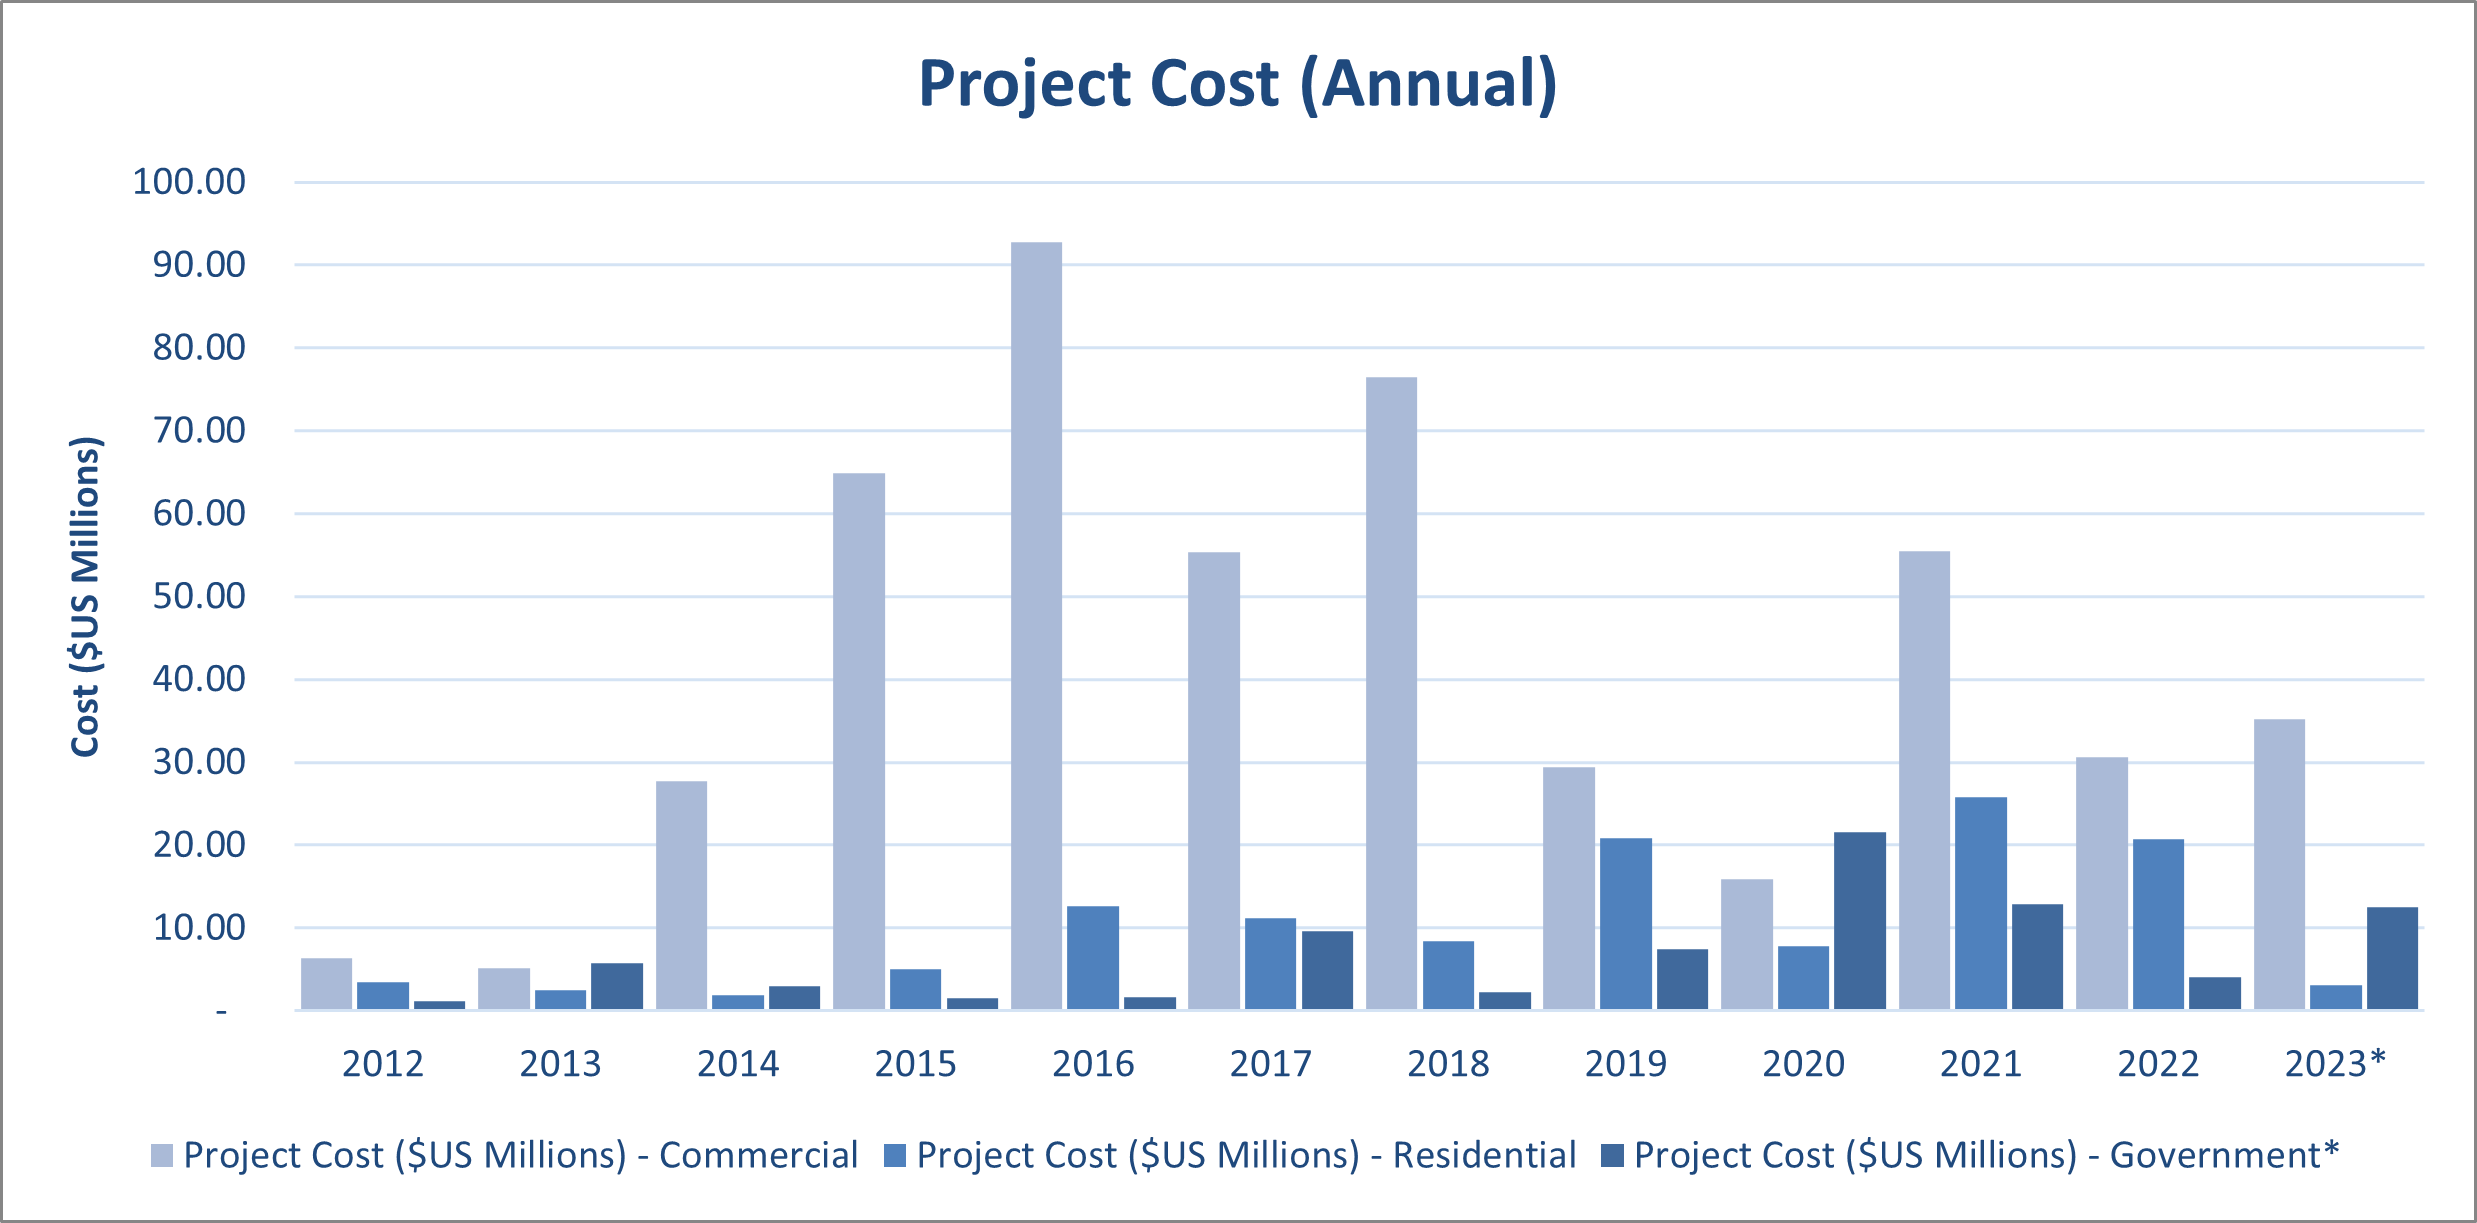
EI Building Permits Issued & Project Cost (Annual)
Building Permits Issued & Project Cost Annual Economic Indicator
Project Cost ($US Millions): values are rounded to Hundredths
Source: Building Safety Code Division, Department of Public Works
*Recent Addition to 2007
*2018.4 – Decrease in the 4th Quarter of 2018 was due to interuptions by Super Typhoon Yutu.
| Permits Issued | % Change from Previous Year |
Commercial | Residential | Government* | Project Cost ($US Millions) |
% Change from Previous Year |
Commercial | Residential | Government* | |
|---|---|---|---|---|---|---|---|---|---|---|
| Source: CNMI Economic Indicators / CSD | ||||||||||
| 2023* | 38 | -77.91% | 12 | 20 | 6 | $50.79 | -8.42% | $35.21 | $3.05 | $12.53 |
| 2022 | 172 | -32.28% | 45 | 110 | 17 | $55.46 | -41.09% | $30.67 | $20.69 | $4.10 |
| 2021 | 254 | -5.58% | 59 | 161 | 34 | $94.15 | 107.73% | $55.47 | $25.78 | $12.90 |
| 2020 | 269 | -35.49% | 69 | 177 | 23 | $45.32 | -21.47% | $15.93 | $7.86 | $21.53 |
| 2019 | 417 | 34.08% | 92 | 312 | 13 | $57.71 | -33.81% | $29.45 | $20.80 | $7.46 |
| 2018 | 311 | -9.06% | 98 | 203 | 10 | $87.19 | 14.46% | $76.46 | $8.47 | $2.26 |
| 2017 | 342 | -7.32% | 111 | 211 | 20 | $76.18 | -28.91% | $55.41 | $11.14 | $9.63 |
| 2016 | 369 | 74.06% | 140 | 215 | 14 | $107.16 | 50.04% | $92.79 | $12.68 | $1.69 |
| 2015 | 212 | 87.61% | 94 | 107 | 11 | $71.42 | 119.19% | $64.88 | $5.06 | $1.48 |
| 2014 | 113 | -16.30% | 66 | 39 | 8 | $32.58 | 142.23% | $27.68 | $1.94 | $2.96 |
| 2013 | 135 | 29.81% | 64 | 46 | 25 | $13.45 | 21.75% | $5.18 | $2.48 | $5.79 |
| 2012 | 104 | -27.78% | 43 | 47 | 14 | $11.05 | -66.50% | $6.38 | $3.46 | $1.21 |
| 2011 | 144 | 4.35% | 71 | 53 | 20 | $32.98 | 134.87% | $23.11 | $2.54 | $7.33 |
| 2010 | 138 | 15.00% | 69 | 49 | 20 | $14.04 | -13.49% | $3.36 | $3.41 | $7.28 |
| 2009 | 120 | -43.66% | 55 | 45 | 20 | $16.23 | -63.10% | $2.77 | $3.53 | $9.94 |
| 2008 | 213 | -16.47% | 106 | 98 | 9 | $43.99 | 171.09% | $36.40 | $5.12 | $2.47 |
| 2007 | 255 | -12.67% | 121 | 120 | 14 | $16.23 | 43.06% | $8.96 | $5.06 | $2.21 |
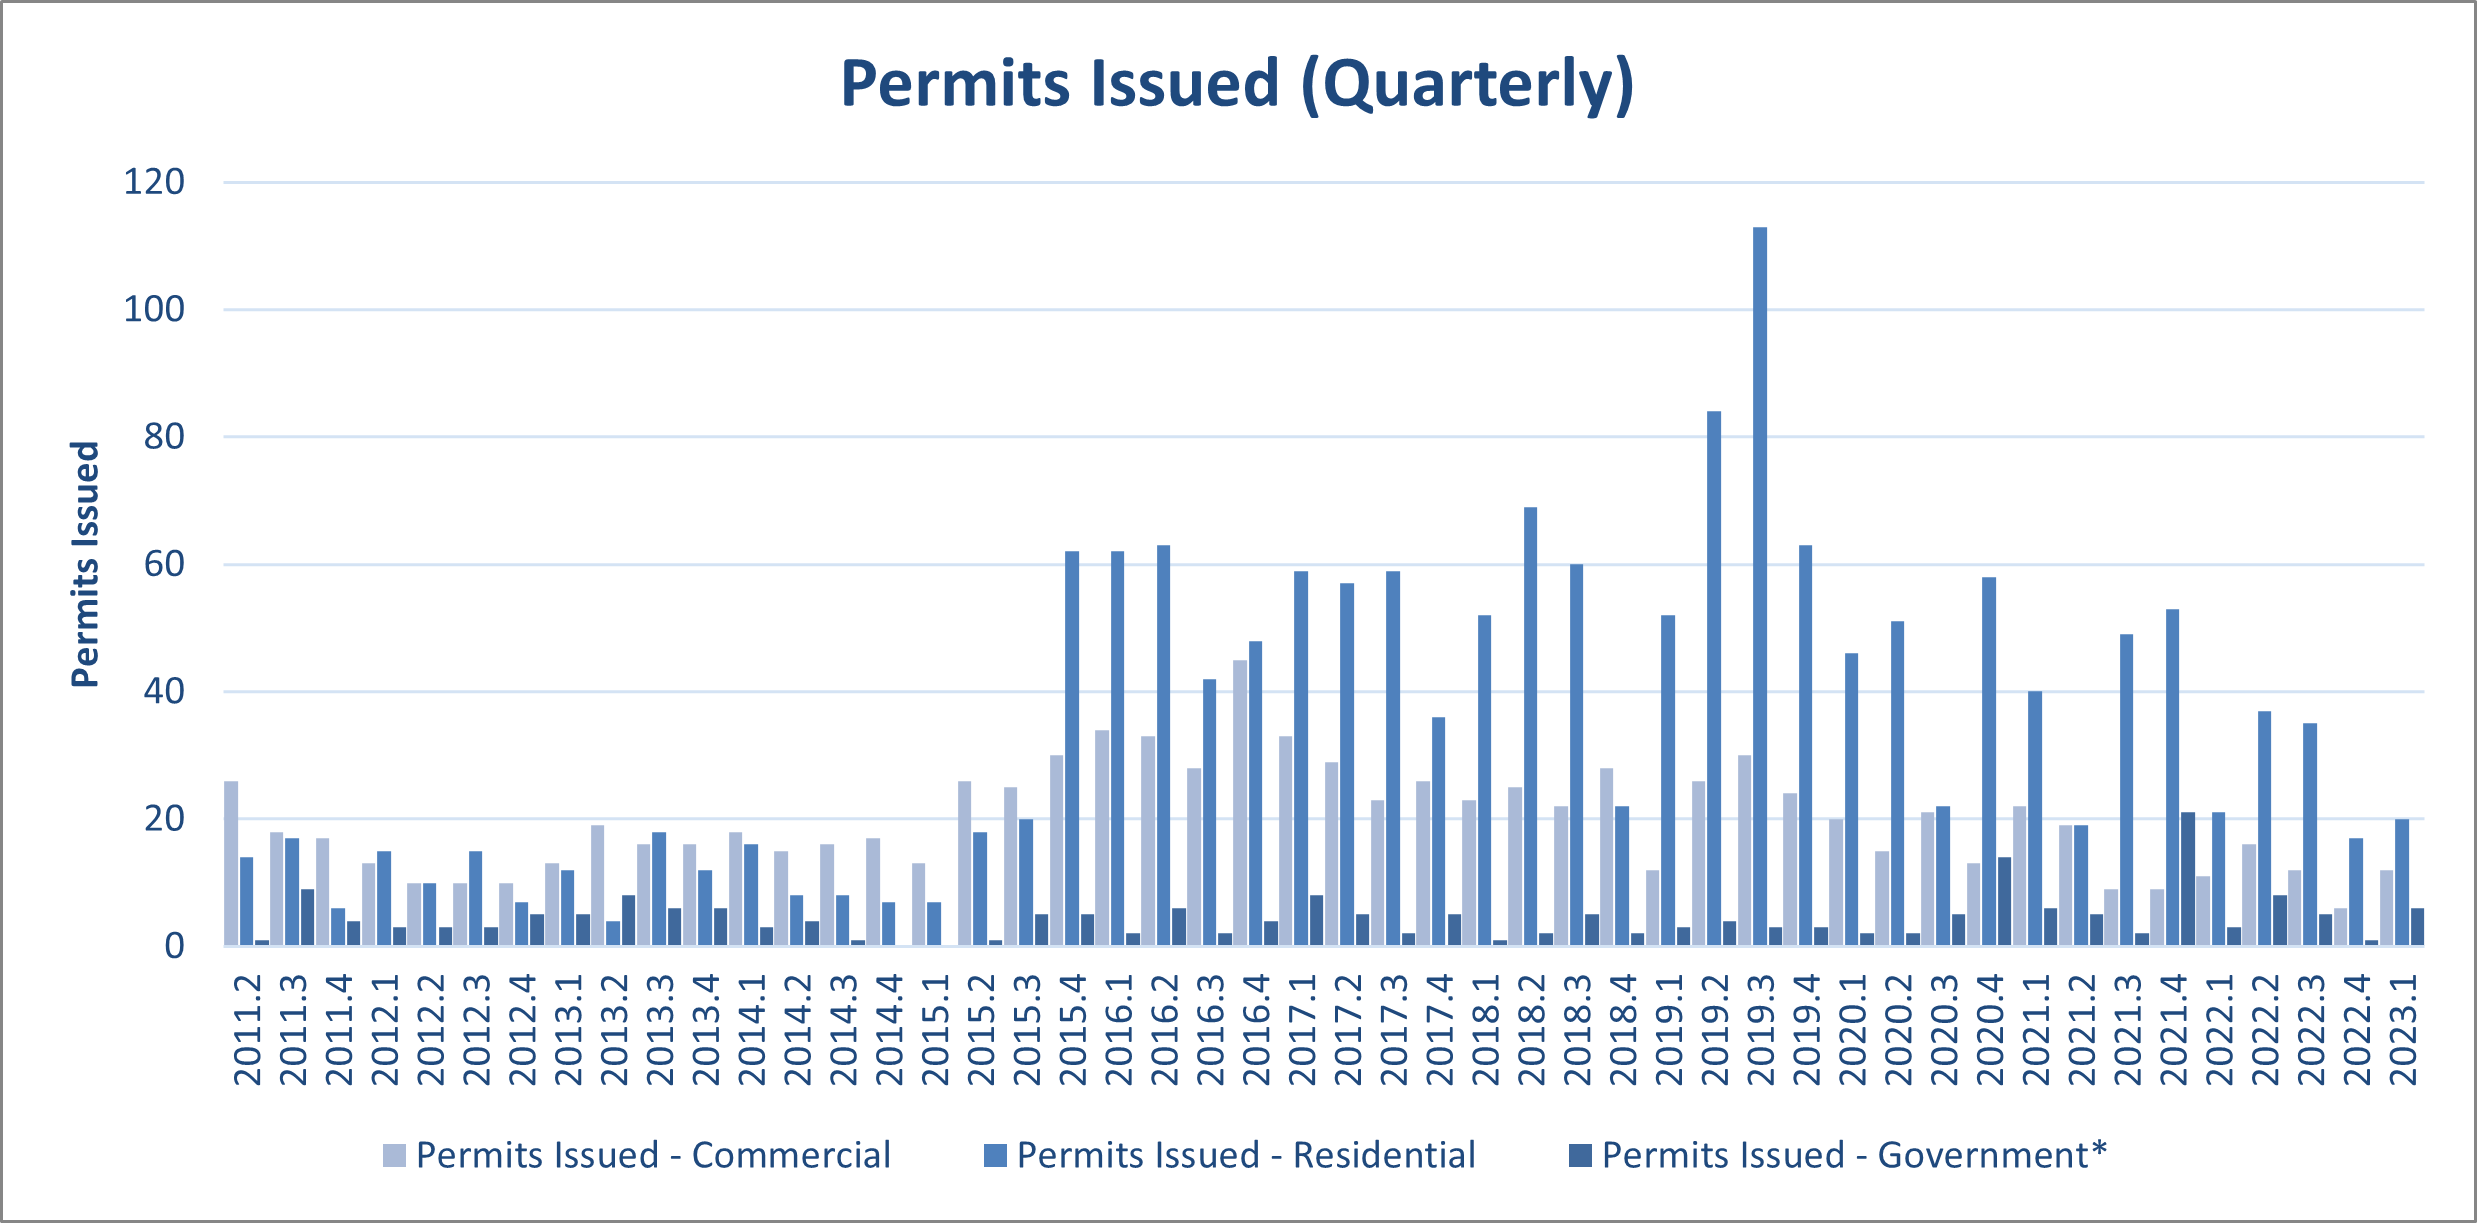
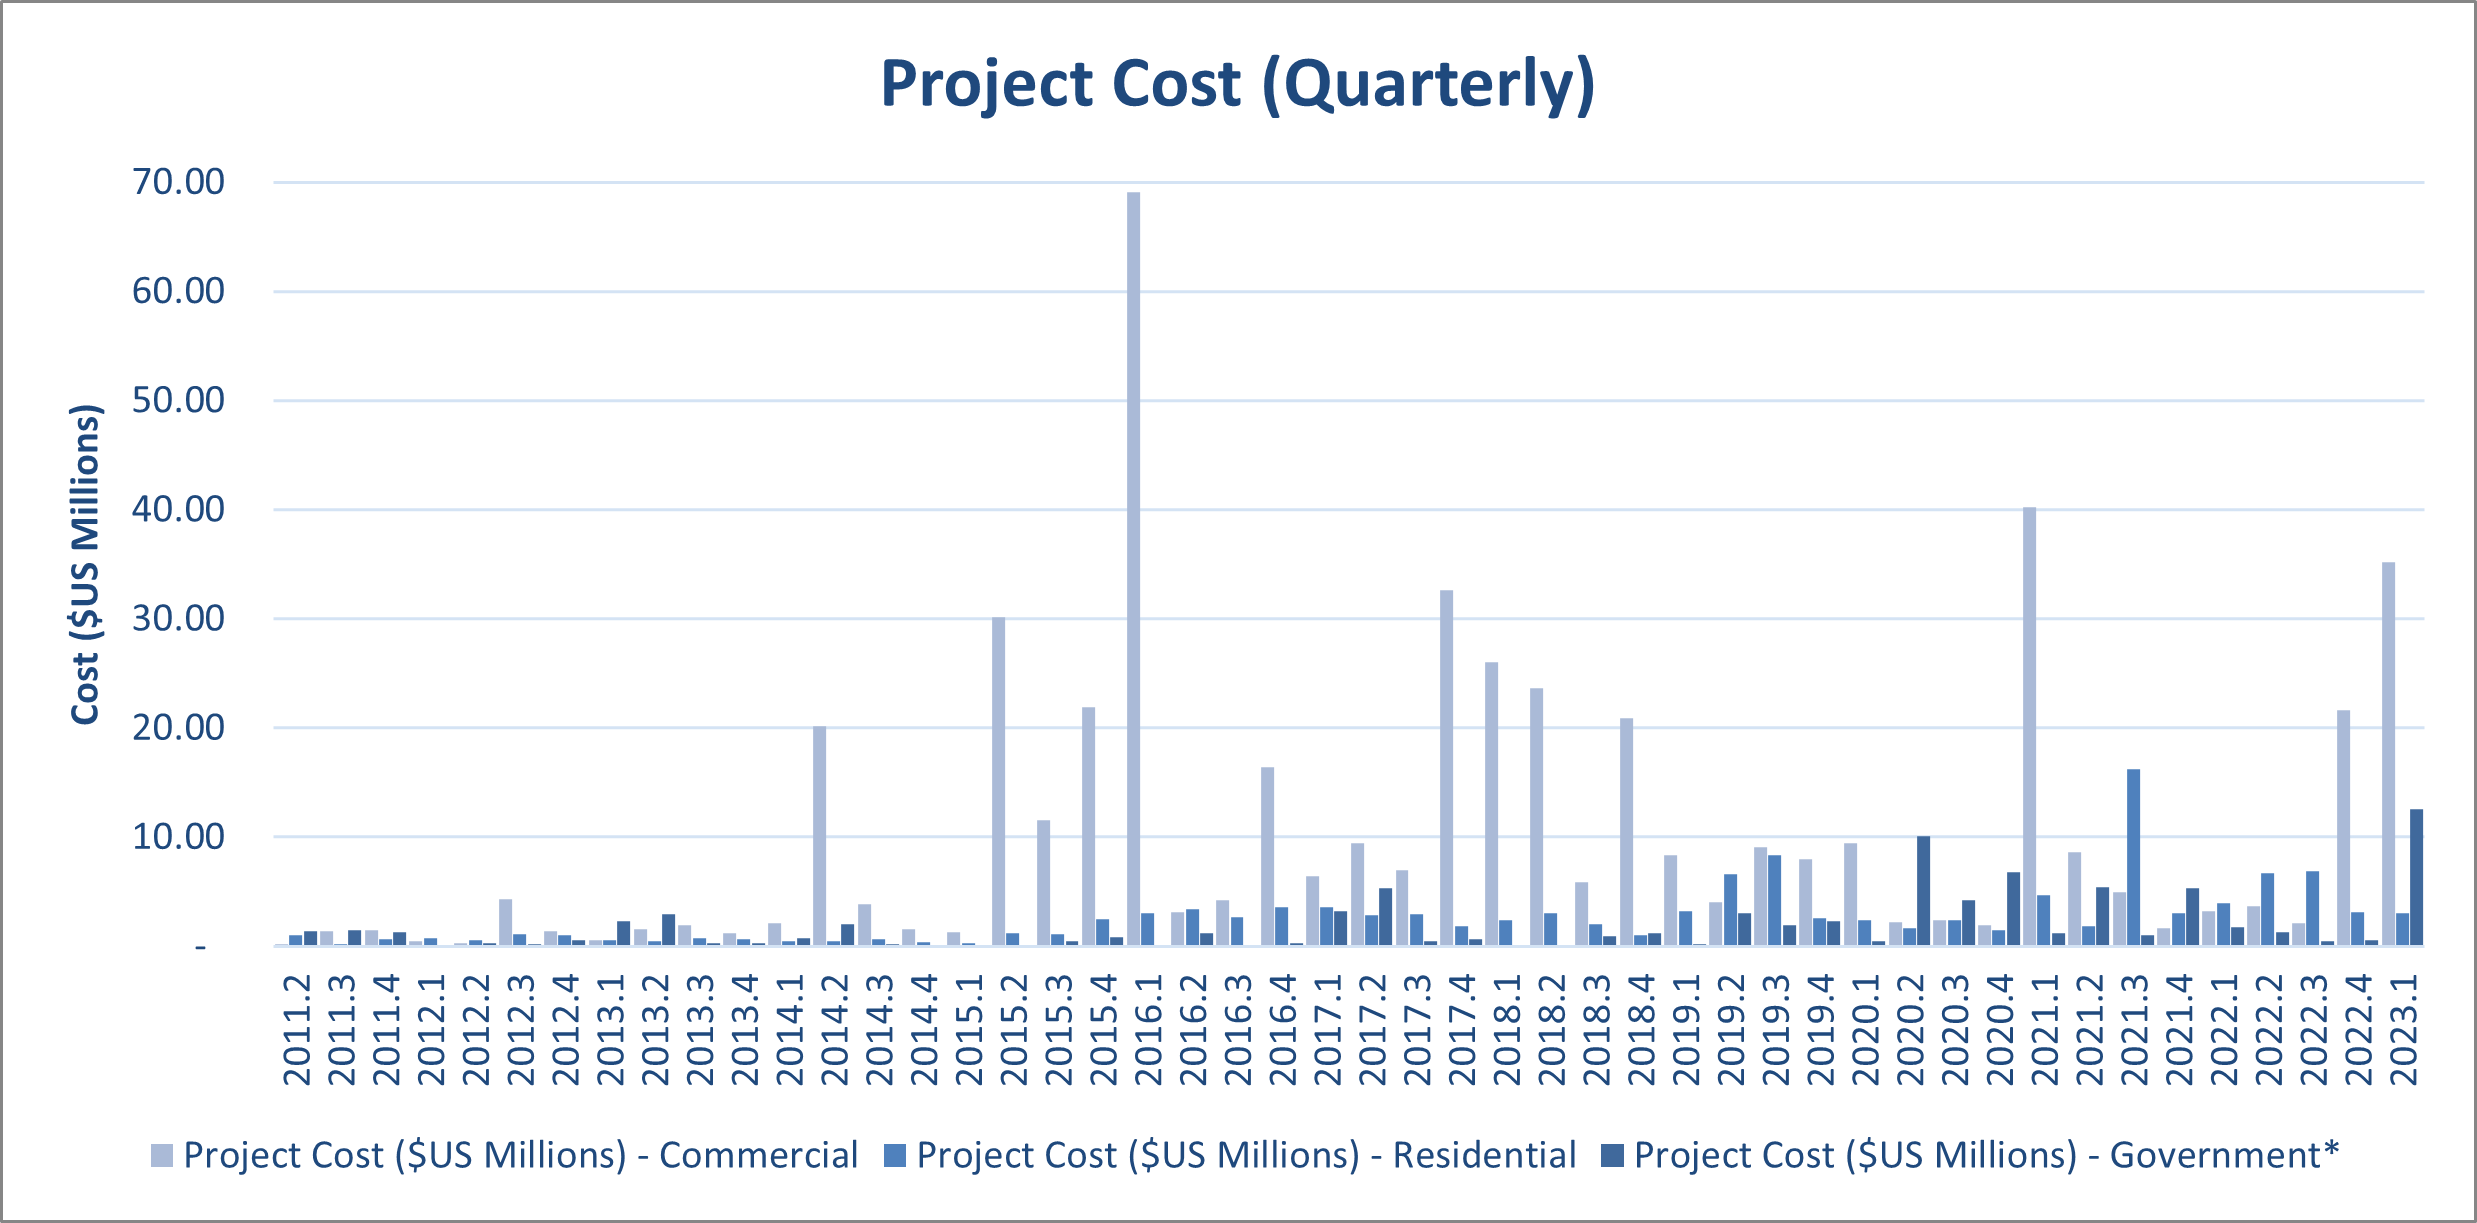
EI Building Permits Issued & Project Cost (Quarterly)
Building Permits Issued & Project Cost Quarterly Economic Indicator
Project Cost ($US Millions): values are rounded to Hundredths
Source: Building Safety Code Division, Department of Public Works
*Recent Addition to 2007
*2018.4 – Decrease in the 4th Quarter of 2018 was due to interuptions by Super Typhoon Yutu.
| Permits Issued | % Change from Previous Quarter | Commercial | Residential | Government* | Project Cost ($US Millions) |
% Change from Previous Quarter | Commercial | Residential | Government* | |
|---|---|---|---|---|---|---|---|---|---|---|
| Source: CNMI Economic Indicator / CSD | ||||||||||
| 2023.1 | 38 | 58.33% | 12 | 20 | 6 | $50.79 | 101.04% | $35.21 | $3.05 | $12.53 |
| 2022.4 | 24 | -53.85% | 6 | 17 | 1 | $25.26 | 164.04% | $21.64 | $3.08 | $0.55 |
| 2022.3 | 52 | -14.75% | 12 | 35 | 5 | $9.57 | -18.04% | $2.15 | $6.92 | $0.50 |
| 2022.2 | 61 | 74.29% | 16 | 37 | 8 | $11.67 | 30.34% | $3.67 | $6.72 | $1.29 |
| 2022.1 | 35 | -57.83% | 11 | 21 | 3 | $8.96 | -11.06% | $3.22 | $3.97 | $1.76 |
| 2021.4 | 83 | 38.33% | 9 | 53 | 21 | $10.07 | -54.51% | $1.70 | $3.01 | $5.35 |
| 2021.3 | 60 | 39.53% | 9 | 49 | 2 | $22.14 | 39.68% | $4.92 | $16.21 | $1.01 |
| 2021.2 | 43 | -36.76% | 19 | 19 | 5 | $15.85 | -65.61% | $8.62 | $1.85 | $5.37 |
| 2021.1 | 68 | -20.00% | 22 | 40 | 6 | $46.09 | 355.32% | $40.22 | $4.70 | $1.17 |
| 2020.4 | 85 | 77.08% | 13 | 58 | 14 | $10.12 | 12.61% | $1.92 | $1.44 | $6.76 |
| 2020.3 | 48 | -29.41% | 21 | 22 | 5 | $8.99 | -35.43% | $2.35 | $2.43 | $4.21 |
| 2020.2 | 68 | 0.00% | 15 | 51 | 2 | $13.92 | 13.26% | $2.22 | $1.62 | $10.08 |
| 2020.1 | 68 | -24.44% | 20 | 46 | 2 | $12.29 | -4.45% | $9.44 | $2.36 | $0.49 |
| 2019.4 | 90 | -38.36% | 24 | 63 | 3 | $12.86 | -33.55% | $8.01 | $2.60 | $2.25 |
| 2019.3 | 146 | 28.07% | 30 | 113 | 3 | $19.36 | 41.03% | $9.09 | $8.34 | $1.93 |
| 2019.2 | 114 | 70.15% | 26 | 84 | 4 | $13.73 | 16.64% | $4.04 | $6.62 | $3.07 |
| 2019.1 | 67 | 28.85% | 12 | 52 | 3 | $11.77 | -48.95% | $8.31 | $3.25 | $0.21 |
| 2018.4 | 52 | -40.23% | 28 | 22 | 2 | $23.05 | 161.77% | $20.90 | $0.97 | $1.18 |
| 2018.3 | 87 | -9.38% | 22 | 60 | 5 | $8.81 | -67.17% | $5.83 | $2.04 | $0.94 |
| 2018.2 | 96 | 26.32% | 25 | 69 | 2 | $26.82 | -5.92% | $23.69 | $3.05 | $0.09 |
| 2018.1 | 76 | 13.43% | 23 | 52 | 1 | $28.51 | -18.82% | $26.05 | $2.41 | $0.05 |
| 2017.4 | 67 | -20.24% | 26 | 36 | 5 | $35.12 | 239.90% | $32.66 | $1.80 | $0.66 |
| 2017.3 | 84 | -7.69% | 23 | 59 | 2 | $10.33 | -41.04% | $6.96 | $2.95 | $0.43 |
| 2017.2 | 91 | -9.00% | 29 | 57 | 5 | $17.52 | 32.72% | $9.41 | $2.81 | $5.30 |
| 2017.1 | 100 | 3.09% | 33 | 59 | 8 | $13.20 | -34.92% | $6.38 | $3.58 | $3.24 |
| 2016.4 | 97 | 34.72% | 45 | 48 | 4 | $20.29 | 192.67% | $16.45 | $3.60 | $0.24 |
| 2016.3 | 72 | -29.41% | 28 | 42 | 2 | $6.93 | -10.40% | $4.21 | $2.64 | $0.08 |
| 2016.2 | 102 | 4.08% | 33 | 63 | 6 | $7.74 | -89.29% | $3.08 | $3.42 | $1.24 |
| 2016.1 | 98 | 1.03% | 34 | 62 | 2 | $72.21 | 186.88% | $69.04 | $3.03 | $0.13 |
| 2015.4 | 97 | 94.00% | 30 | 62 | 5 | $25.17 | 91.45% | $21.91 | $2.46 | $0.80 |
| 2015.3 | 50 | 11.11% | 25 | 20 | 5 | $13.15 | -58.10% | $11.56 | $1.10 | $0.49 |
| 2015.2 | 45 | 125.00% | 26 | 18 | 1 | $31.38 | 1718.68% | $30.14 | $1.19 | $0.04 |
| 2015.1 | 20 | -16.67% | 13 | 7 | 0 | $1.73 | -11.20% | $1.28 | $0.31 | $0.14 |
| 2014.4 | 24 | -4.00% | 17 | 7 | 0 | $1.94 | -57.87% | $1.54 | $0.41 | 0 |
| 2014.3 | 25 | -7.41% | 16 | 8 | 1 | $4.61 | -79.69% | $3.82 | $0.62 | $0.17 |
| 2014.2 | 27 | -27.03% | 15 | 8 | 4 | $22.71 | 583.44% | $20.20 | $0.48 | $2.03 |
| 2014.1 | 37 | 8.82% | 18 | 16 | 3 | $3.32 | 61.30% | $2.13 | $0.44 | $0.75 |
| 2013.4 | 34 | -15.00% | 16 | 12 | 6 | $2.06 | -30.56% | $1.18 | $0.62 | $0.27 |
| 2013.3 | 40 | 29.03% | 16 | 18 | 6 | $2.97 | -40.44% | $1.90 | $0.78 | $0.28 |
| 2013.2 | 31 | 3.33% | 19 | 4 | 8 | $4.98 | 44.62% | $1.56 | $0.51 | $2.91 |
| 2013.1 | 30 | 36.36% | 13 | 12 | 5 | $3.44 | 15.35% | $0.54 | $0.57 | $2.33 |
| 2012.4 | 22 | -21.43% | 10 | 7 | 5 | $2.99 | -47.16% | $1.38 | $1.01 | $0.59 |
| 2012.3 | 28 | 21.74% | 10 | 15 | 3 | $5.65 | 427.02% | $4.31 | $1.14 | $0.20 |
| 2012.2 | 23 | -25.81% | 10 | 10 | 3 | $1.07 | -20.00% | $0.24 | $0.53 | $0.30 |
| 2012.1 | 31 | 14.81% | 13 | 15 | 3 | $1.34 | -60.12% | $0.44 | $0.78 | $0.11 |
| 2011.4 | 27 | -38.64% | 17 | 6 | 4 | $3.36 | 8.87% | $1.44 | $0.61 | $1.31 |
| 2011.3 | 44 | 7.32% | 18 | 17 | 9 | $3.09 | 19.18% | $1.40 | $0.22 | $1.47 |
| 2011.2 | 41 | 28.13% | 26 | 14 | 1 | $2.59 | -89.18% | $0.15 | $1.03 | $1.41 |
| 2011.1 | 32 | 3.23% | 10 | 16 | 6 | $23.95 | 984.06% | $20.13 | $0.67 | $3.14 |
| 2010.4 | 31 | -29.55% | 18 | 5 | 8 | $2.21 | -71.03% | $0.92 | $0.44 | $0.85 |
| 2010.3 | 44 | 7.32% | 18 | 17 | 9 | $7.62 | 138.97% | $0.82 | $0.77 | $6.03 |
| 2010.2 | 41 | 86.36% | 26 | 14 | 1 | $3.19 | 212.74% | $1.56 | $1.35 | $0.27 |
| 2010.1 | 22 | 15.79% | 7 | 13 | 2 | $1.02 | -18.63% | $0.06 | $0.84 | $0.12 |
| 2009.4 | 19 | -42.42% | 8 | 10 | 1 | $1.25 | -49.91% | $0.95 | $0.30 | 0 |
| 2009.3 | 33 | -5.71% | 11 | 14 | 8 | $2.50 | -75.33% | $0.27 | $1.38 | $0.86 |
| 2009.2 | 35 | 6.06% | 21 | 10 | 4 | $10.14 | 335.09% | $0.80 | $0.85 | $8.49 |
| 2009.1 | 33 | -23.26% | 15 | 11 | 7 | $2.33 | -80.62% | $0.74 | $1.00 | $0.59 |
| 2008.4 | 43 | -23.21% | 27 | 15 | 1 | $12.03 | -18.53% | $11.25 | $0.77 | 0 |
| 2008.3 | 56 | -1.75% | 24 | 32 | 0 | $14.76 | 20.46% | $12.76 | $2.00 | 0 |
| 2008.2 | 57 | 0.00% | 24 | 26 | 7 | $12.26 | 148.10% | $9.33 | $0.75 | $2.18 |
| 2008.1 | 57 | -10.94% | 31 | 25 | 1 | $4.94 | 11.14% | $3.06 | $1.59 | $0.30 |
| 2007.4 | 64 | 14.29% | 35 | 22 | 7 | $4.45 | -0.25% | $1.51 | $1.10 | $1.84 |
| 2007.3 | 56 | -21.13% | 30 | 19 | 7 | $4.46 | 47.23% | $3.23 | $0.86 | $0.37 |
| 2007.2 | 71 | 10.94% | 35 | 36 | 0 | $3.03 | -29.61% | $1.77 | $1.26 | 0 |
| 2007.1 | 64 | 36.17% | 21 | 43 | 0 | $4.30 | 103.79% | $2.46 | $1.84 | 0 |
Economic Indicator
To download chart, right click on the chart and select “Save Image As”…