IntroTable DataCharts and Figures Data
Economic Indicator
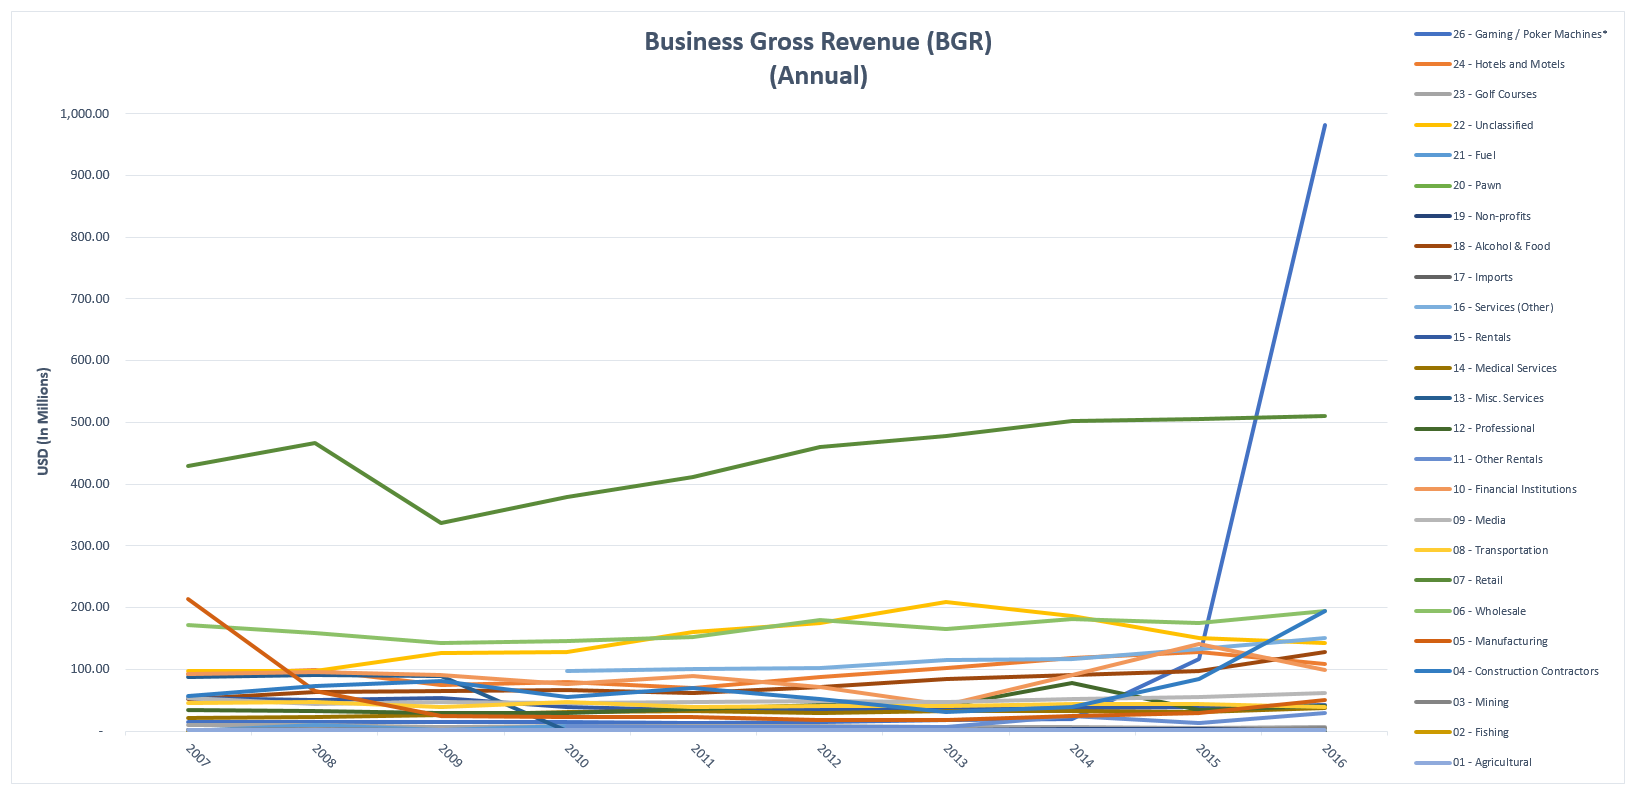
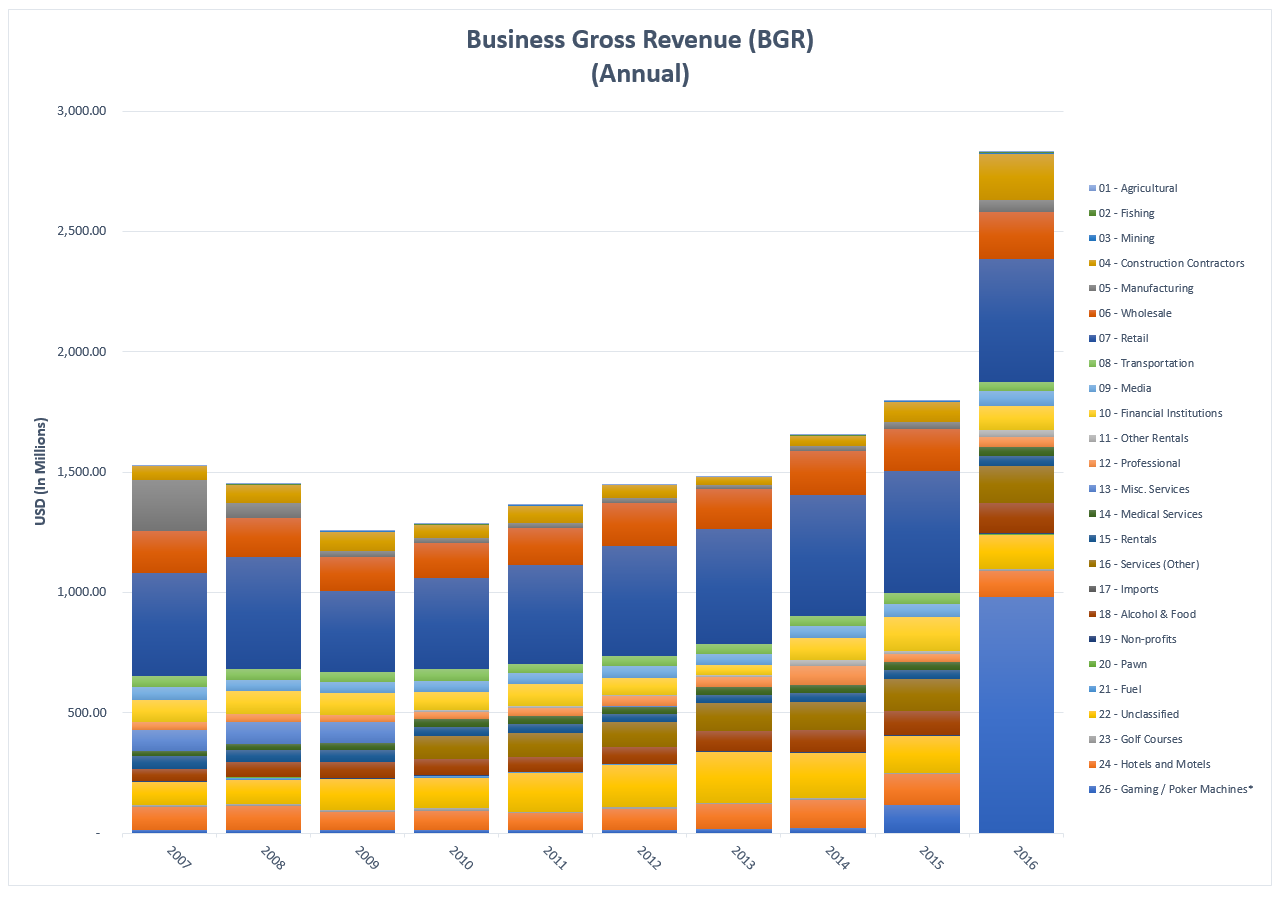
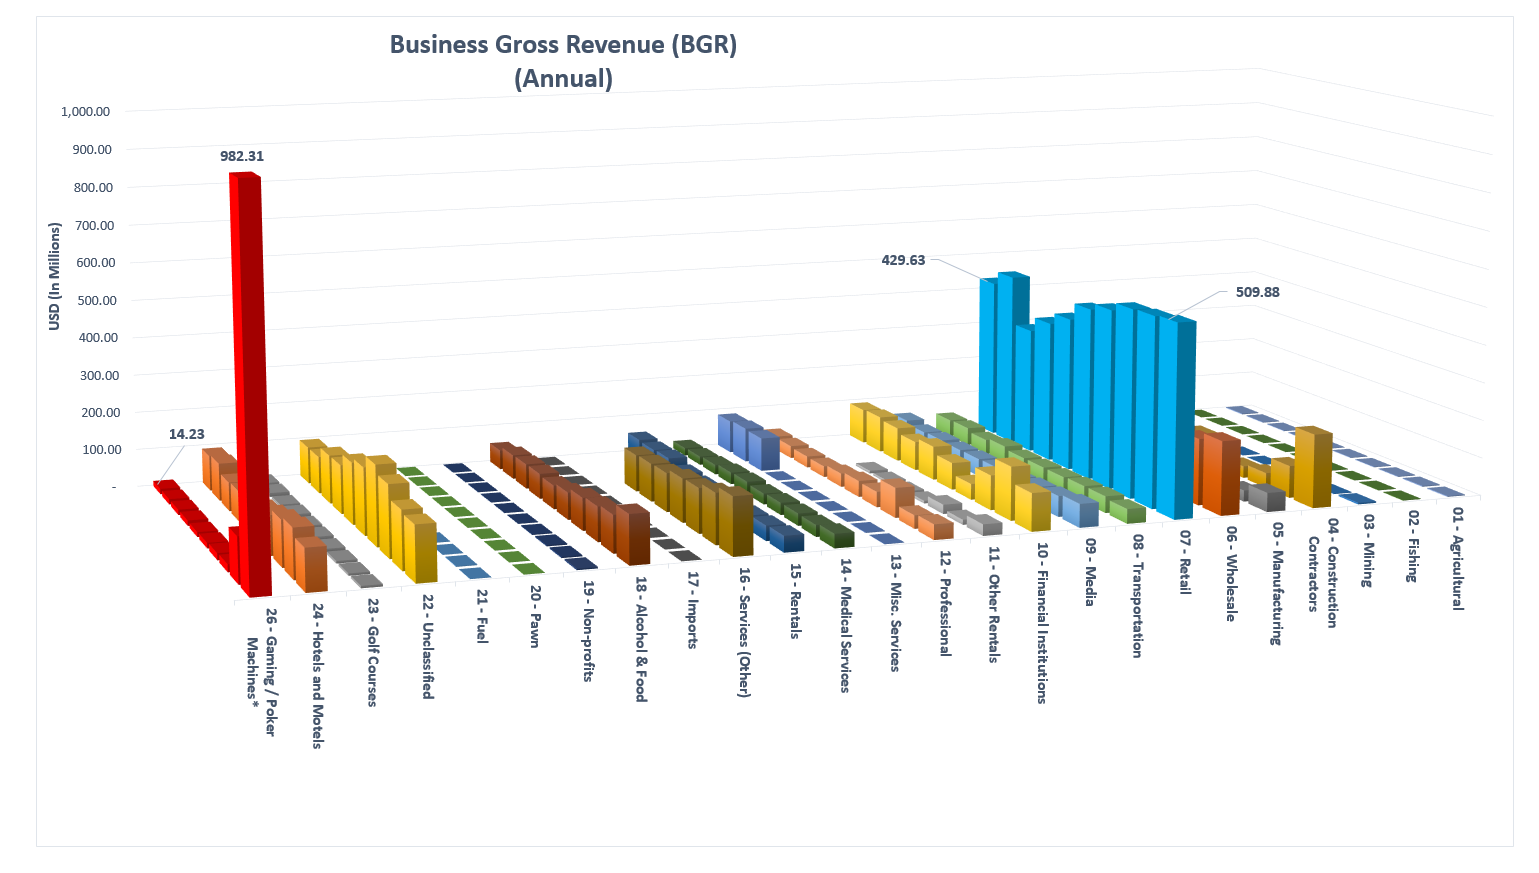
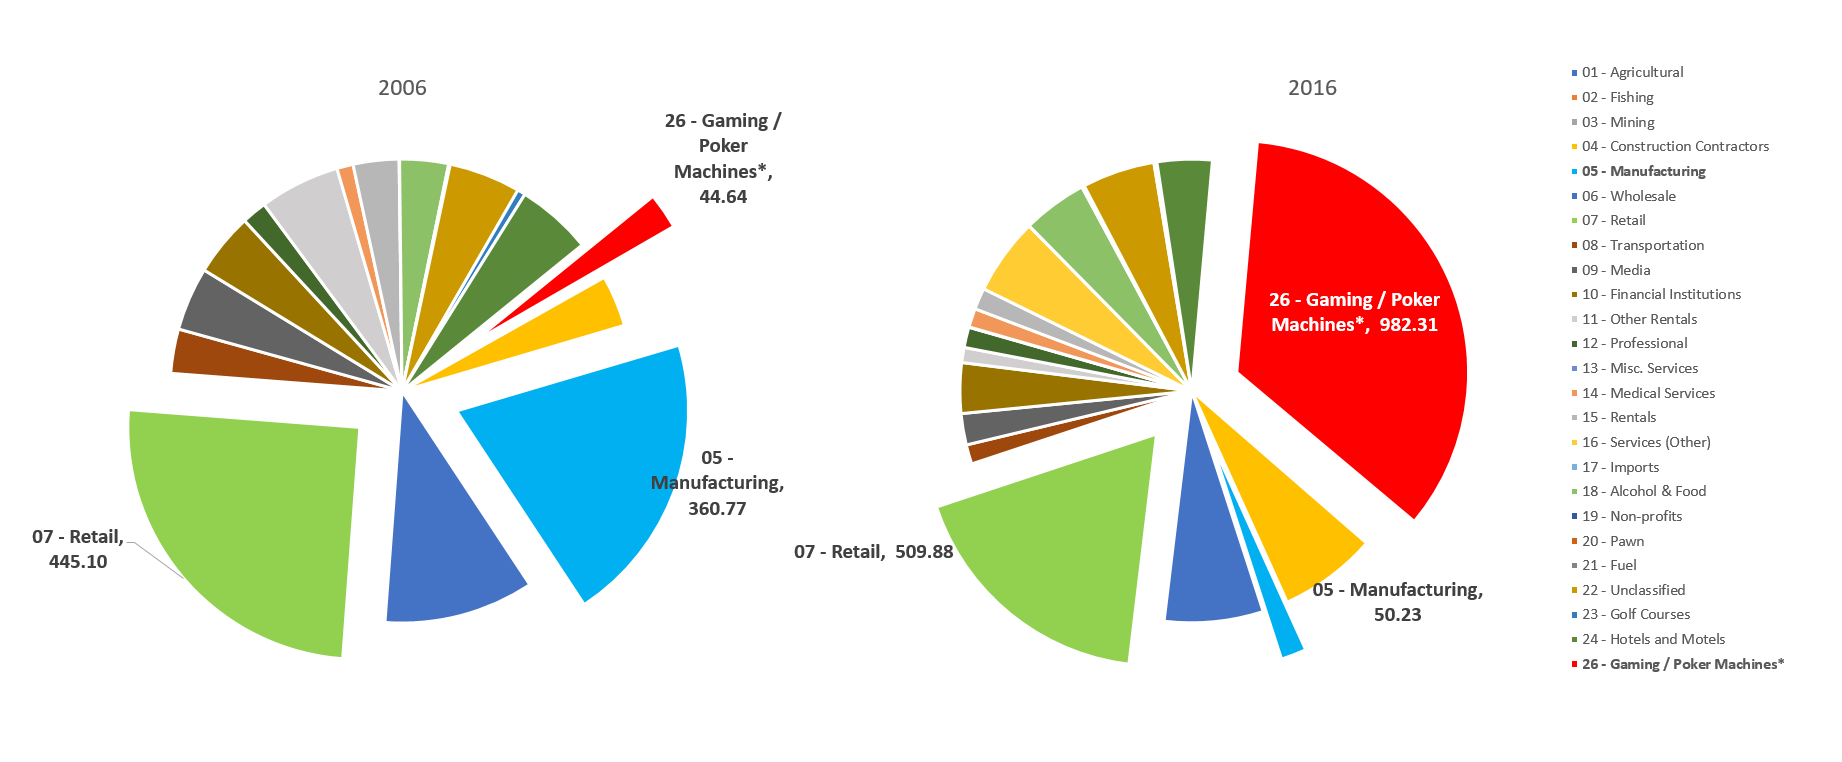
Economic Indicator (EI) Data as it relates to Business Gross Revenue (BGR), quarters 1 through 4. Business Gross Revenue (BGR) Annual Reports are reflected off the 4th Quarter of their respected Year
Economic Indicator
EI Business Gross Revenue (Annual)
Business Gross Revenue (BGR) Economic Indicator
Source: Department of Finance
13 – Misc. Services* – Prior to 2009, Misc. Services included Services (Other).
15 – Rentals* – Prior to 2009, Rentals included Other Rentals.
26 – Gaming / Poker Machines* – Prior to 2016, Poker Machine category included gaming activities of poker rooms, electronic gaming, and casino. In 2016, Gaming became a new category.
| 2016 | 2015 | 2014 | 2013 | 2012 | 2011 | 2010 | 2009 | 2008 | 2007 | 2006 | |
|---|---|---|---|---|---|---|---|---|---|---|---|
| Source: Economic Indicators 2017 CNMI CSD | |||||||||||
| 01 – Agricultural | 2.25 | 2.45 | 1.92 | 1.49 | 1.62 | 1.25 | 1.73 | 1.67 | 1.82 | 2.32 | 2.37 |
| 02 – Fishing | 1.5 | 1.34 | 1.48 | 1.39 | 1.28 | 0.96 | 0.68 | 0.94 | 0.92 | – | – |
| 03 – Mining | 4.31 | 1.73 | 1.25 | 0.77 | 0.9 | 1.17 | 0.72 | 1.23 | 3.1 | 1.16 | 0.84 |
| 04 – Construction Contractors | 193.85 | 84.86 | 39.31 | 31.42 | 52.42 | 70.09 | 54.7 | 81 | 72.44 | 57.41 | 63.6 |
| 05 – Manufacturing | 50.23 | 29.52 | 23.77 | 17.58 | 18.7 | 23.44 | 23.04 | 24.22 | 64.61 | 213.66 | 360.77 |
| 06 – Wholesale | 195.14 | 175.45 | 181.56 | 165.78 | 179.69 | 152 | 145.43 | 142.39 | 159.36 | 171.48 | 185.83 |
| 07 – Retail | 509.88 | 504.93 | 501.61 | 478.31 | 459.54 | 411.36 | 378.48 | 337.11 | 467.15 | 429.63 | 445.1 |
| 08 – Transportation | 38.4 | 43.95 | 43.48 | 40.46 | 40.05 | 39.42 | 46.3 | 38.86 | 47.12 | 45.04 | 54.97 |
| 09 – Media | 61.76 | 54.46 | 51.28 | 47.83 | 48.04 | 46.42 | 45.52 | 47.01 | 44.44 | 53.28 | 78.64 |
| 10 – Financial Institutions | 99.65 | 140.8 | 91.26 | 41.87 | 71.49 | 89.77 | 77.01 | 90.08 | 96.01 | 92.21 | 78.07 |
| 11 – Other Rentals | 29.88 | 13.18 | 24.42 | 7.04 | 6.05 | 6.55 | 7.43 | ||||
| 12 – Professional | 40.09 | 34.95 | 78.45 | 40.8 | 42.72 | 35.64 | 28.93 | 30.07 | 33.21 | 34.52 | 30.96 |
| 13 – Misc. Services | 0.83 | 1.43 | 0.84 | 0.76 | 0.72 | 1.03 | 0.73 | 89.28 | 91.28 | 86.91 | 99.63 |
| 14 – Medical Services | 37.04 | 30.79 | 31.99 | 32.03 | 28.79 | 33.26 | 31.34 | 25.92 | 22.74 | 20.66 | 20.14 |
| 15 – Rentals | 42.37 | 39.49 | 37.08 | 35.57 | 35.13 | 34.8 | 38.58 | 53.37 | 50.39 | 52.93 | 56.75 |
| 16 – Services (Other) | 151.48 | 132.79 | 117.56 | 115.09 | 102.21 | 100.36 | 97.17 | ||||
| 17 – Imports | 0.37 | 0.21 | 0.23 | 0.16 | 0.09 | 0.12 | 0.3 | 0.23 | 0.22 | 0.26 | 0.49 |
| 18 – Alcohol & Food | 127.77 | 97.54 | 90.61 | 84.96 | 71.07 | 62.41 | 66.58 | 65.7 | 64.02 | 51.75 | 60.45 |
| 19 – Non-profits | 3.94 | 3.53 | 3.33 | 2.2 | 1.24 | 1.35 | 1.45 | 1.73 | 1.44 | 1.29 | 1 |
| 20 – Pawn | 0.63 | 0.71 | 0.74 | 0.81 | 0.89 | 0.91 | 0.98 | 1.02 | 1.11 | 0.85 | 0.92 |
| 21 – Fuel | 0.53 | 1.63 | 0.55 | 1.05 | 1.33 | 1.89 | 7.87 | 1.8 | 10.18 | – | – |
| 22 – Unclassified | 143.48 | 151.19 | 186.51 | 208.51 | 174.75 | 160.63 | 127.68 | 126.86 | 97.15 | 97.07 | 88.7 |
| 23 – Golf Courses | 5.92 | 5.8 | 6.47 | 7.03 | 8.03 | 7.55 | 9 | 7.12 | 10.32 | 9.21 | 9.95 |
| 24 – Hotels and Motels | 108.63 | 128.17 | 118.72 | 102.17 | 87.67 | 69.26 | 79.17 | 75.23 | 98.52 | 92.26 | 93.68 |
| 26 – Gaming / Poker Machines* | 982.31 | 117.4 | 20.15 | 17.75 | 14.32 | 12.61 | 14.11 | 14.07 | 14.06 | 14.23 | 44.64 |
| Gaming | 982.31 | 117.4 | |||||||||
| Poker Machines | 20.15 | 17.75 | 14.32 | 12.61 | 14.11 | 14.07 | 14.06 | 14.23 | 44.64 |
Economic Indicator
To download, right click on the chart and select “Save Image As”…