


Economic Indicator
Economic Indicator (EI) Data as it relates to Exports, quarters 1 through 4. Exports Annual Reports are reflected off the 4th Quarter of their respected Year
Economic Indicator
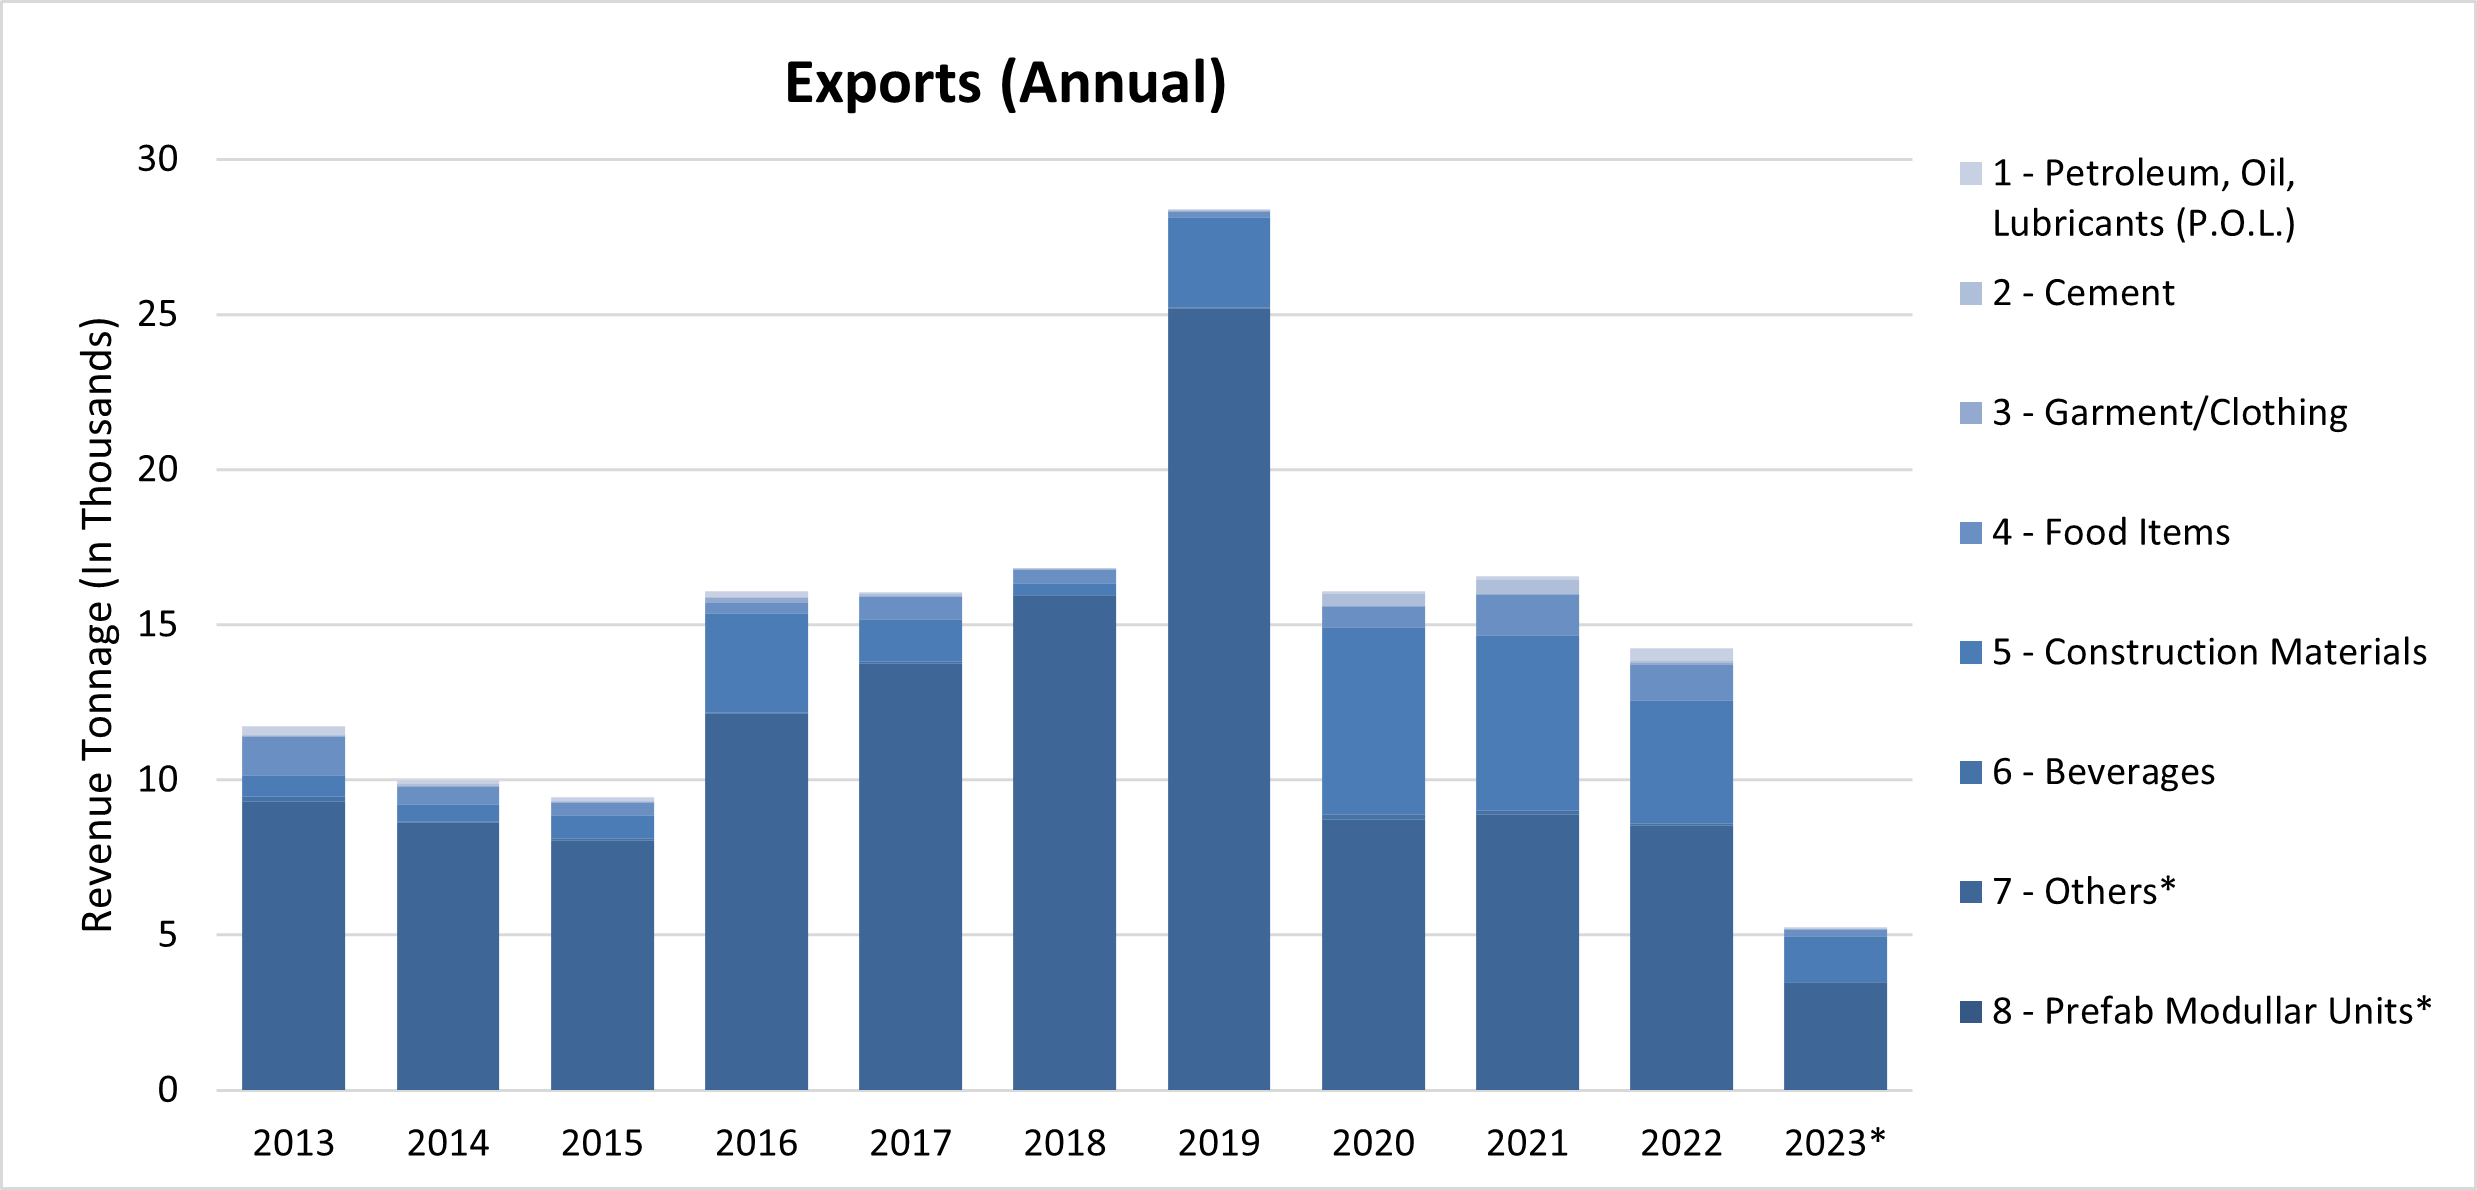
EI Exports (Annual)
Exports Annual Economic Indicator
Source: Port of Saipan, Commonwealth Ports Authority (CPA)
Note: All figures are in Revenue Tons
P.O.L. is Petroleum, Oil, Lubricants
| Total Revenue Tonnage (In Thousands) | % Change to Previous Quarter | 1 – Petroleum, Oil, Lubricants (P.O.L.) | 2 – Cement | 3 – Garment | 4 – Food Items | 5 – Construction Materials | 6 – Beverages | 7 – Others* | 8 – Prefab Modullar Units* | |
|---|---|---|---|---|---|---|---|---|---|---|
| Source: CNMI Economic Indicators / CSD | ||||||||||
| 2023* | 5,221.17 | -63.35% | 12.73 | 7.92 | 0 | 231.29 | 1480.94 | 3.28 | 3485.01 | 0 |
| 2022 | 13,170.37 | -21.00% | 388.66 | 58.09 | 58.1 | 1172.12 | 3975.28 | 42.61 | 7475.52 | 0 |
| 2021 | 16,574.17 | 3.03% | 99.18 | 496.33 | 0 | 1312.51 | 5644.8 | 132.2 | 8889.15 | |
| 2020 | 16,087.17 | -43.37% | 76.55 | 386.49 | 15.33 | 687.22 | 6035.06 | 138.86 | 8747.67 | |
| 2019 | 28,407.45 | 68.85% | 57.56 | 6.4 | 3.33 | 207.19 | 2912.75 | 9.53 | 25210.69 | |
| 2018 | 16,824.40 | 5.02% | 28.14 | 0 | 6.65 | 450.19 | 384.94 | 10.29 | 15944.19 | |
| 2017 | 16,020.37 | -0.31% | 9.53 | 92.72 | 0 | 752 | 1330.7 | 82.11 | 13753.33 | |
| 2016 | 16,070.55 | 70.08% | 168.83 | 0 | 172.12 | 356.83 | 3174.75 | 45.09 | 12152.93 | |
| 2015 | 9,448.63 | -5.29% | 144.79 | 6.25 | 21.19 | 416.77 | 731.21 | 74.8 | 8053.62 | |
| 2014 | 9,976.19 | -15.04% | 78.46 | 84.3 | 1.23 | 609.42 | 532.19 | 37.93 | 8632.66 | |
| 2013 | 11,742.38 | 297.21 | 20 | 23.96 | 1246.99 | 678.33 | 159.19 | 9316.71 |
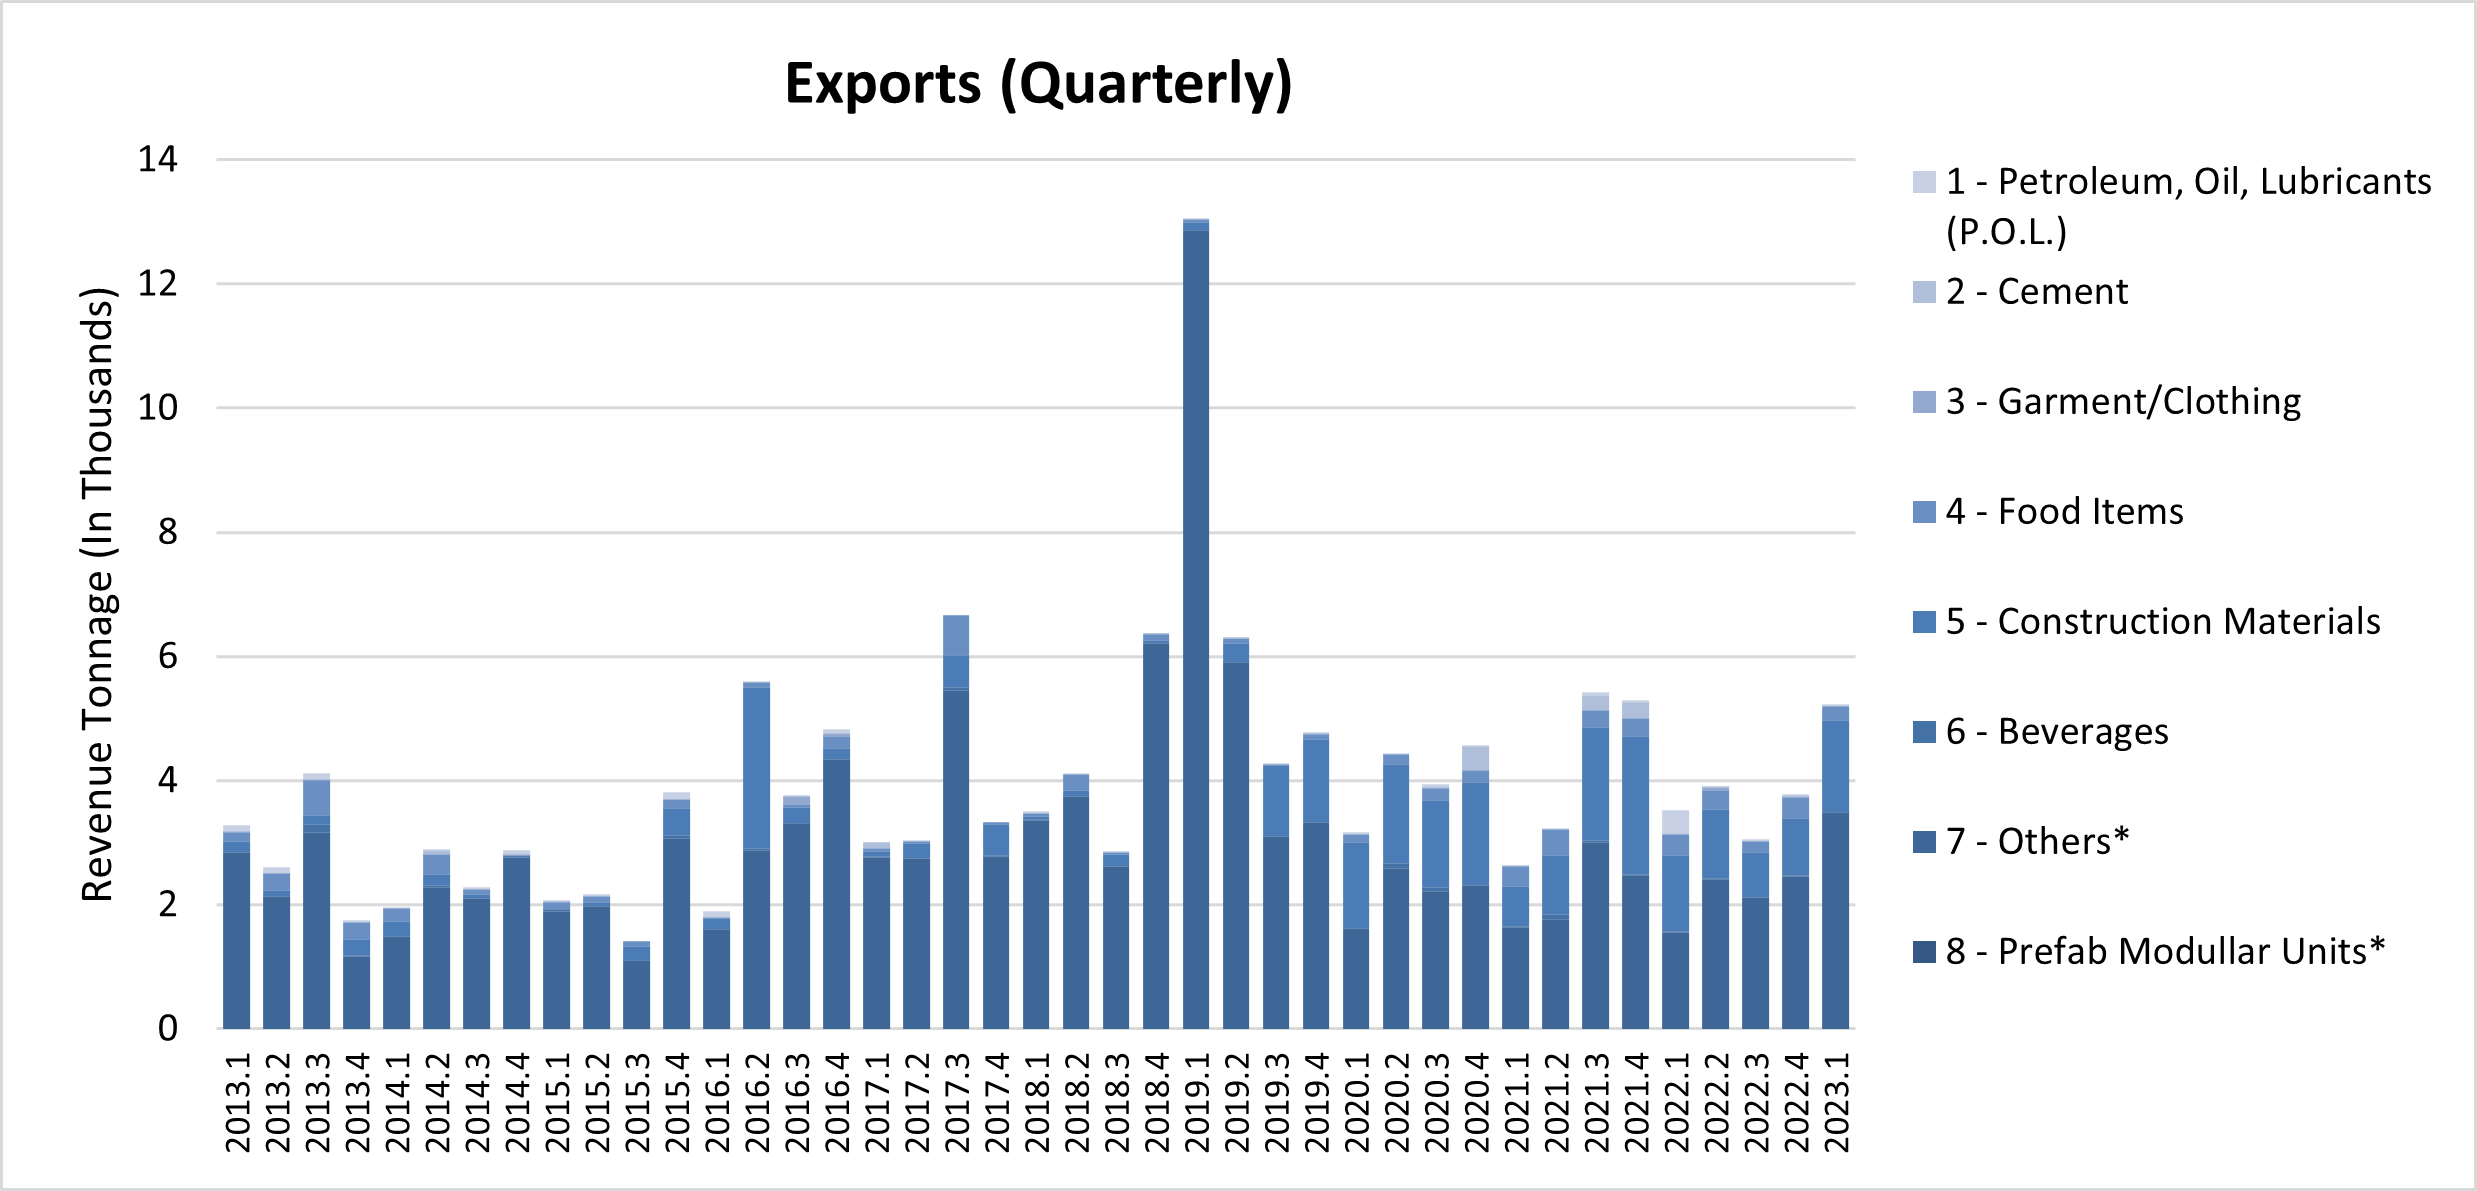
EI Exports (Quarterly)
Exports Annual Economic Indicator
Source: Port of Saipan, Commonwealth Ports Authority (CPA)
Note: All figures are in Revenue Tons
*P.O.L is Petroleum, Oil, Lubricants
| Total Revenue Tonnage (In Thousands) | % Change to Previous Quarter | 1 – Petroleum, Oil, Lubricants (P.O.L.) | 2 – Cement | 3 – Garment | 4 – Food Items | 5 – Construction Materials | 6 – Beverages | 7 – Others* | 8 – Prefab Modullar Units* | |
|---|---|---|---|---|---|---|---|---|---|---|
| Source: CNMI Economic Indicators / CSD | ||||||||||
| 2023.1 | 5,221.17 | 38.72% | 12.73 | 7.92 | 0 | 231.29 | 1480.94 | 3.28 | 3,485.01 | 0 |
| 2022.4 | 2,688.59 | 23.35% | 2.78 | 26.4 | 6.69 | 338.16 | 921.53 | 2.43 | 1,390.60 | 0 |
| 2022.3 | 3,051.31 | -22.05% | 12.49 | 12.23 | 0 | 173.06 | 727.34 | 0 | 2,126.19 | 0 |
| 2022.2 | 3,914.24 | 11.32% | 13.54 | 6.16 | 51.41 | 312.53 | 1,099.38 | 24.61 | 2,406.61 | |
| 2022.1 | 3,516.23 | -33.68% | 359.84 | 13.3 | 0 | 348.38 | 1,227.03 | 15.57 | 1,552.12 | |
| 2021.4 | 5,301.71 | -2.10% | 45.08 | 255.73 | 0 | 287.6 | 2,216.01 | 14.58 | 2,482.71 | |
| 2021.3 | 5,415.52 | 67.90% | 45.9 | 237.1 | 0 | 279.46 | 1,820.86 | 28.46 | 3,003.74 | |
| 2021.2 | 3,225.36 | 22.56% | 8.21 | 0 | 0 | 416.31 | 962.05 | 73.03 | 1,765.76 | |
| 2021.1 | 2,631.58 | -42.29% | 0 | 3.5 | 0 | 329.14 | 645.88 | 16.12 | 1,636.94 | |
| 2020.4 | 4,560.28 | 15.91% | 11.2 | 386.49 | 1.5 | 185.59 | 1,660.85 | 0 | 2,314.65 | |
| 2020.3 | 3,934.24 | -11.13% | 35.81 | 0 | 13.83 | 206.35 | 1,398.37 | 56.91 | 2,222.97 | |
| 2020.2 | 4,426.79 | 39.83% | 1.94 | 0 | 0 | 165.29 | 1,585.84 | 81.95 | 2,591.76 | |
| 2020.1 | 3,165.87 | -33.52% | 27.59 | 0 | 0 | 129.99 | 1,390.00 | 0 | 1,618.28 | |
| 2019.4 | 4,762.08 | 11.09% | 5.91 | 0 | 3.33 | 83.96 | 1,336.66 | 0 | 3,332.23 | |
| 2019.3 | 4,286.64 | -31.92% | 26.5 | 0 | 0 | 5.02 | 1,144.07 | 0 | 3,111.04 | |
| 2019.2 | 6,296.53 | -51.80% | 2.4 | 6.4 | 0 | 78.68 | 296.59 | 3.47 | 5,908.98 | |
| 2019.1 | 13,062.20 | 105.24% | 22.75 | 0 | 0 | 39.53 | 135.42 | 6.06 | 12,858.44 | |
| 2018.4 | 6,364.30 | 123.71% | 0 | 0 | 6.65 | 99.66 | 52.49 | 0 | 6,205.50 | |
| 2018.3 | 2,844.88 | -30.82% | 0.58 | 0 | 0 | 32.07 | 191.17 | 0 | 2,621.06 | |
| 2018.2 | 4,112.16 | 17.39% | 4.98 | 0 | 0 | 267.02 | 88.33 | 0 | 3,751.83 | |
| 2018.1 | 3,503.06 | 5.04% | 22.58 | 0 | 0 | 51.45 | 52.94 | 10.29 | 3,365.80 | |
| 2017.4 | 3,335.04 | -49.90% | 0 | 0 | 0 | 30.5 | 511.54 | 10.31 | 2,782.69 | |
| 2017.3 | 6,656.15 | 120.02% | 0 | 0 | 0 | 643.4 | 505.85 | 47.1 | 5,459.80 | |
| 2017.2 | 3,025.22 | 0.71% | 9.53 | 0 | 0 | 22.23 | 240.03 | 0 | 2,753.44 | |
| 2017.1 | 3,003.95 | -37.70% | 0 | 92.72 | 0 | 55.88 | 73.27 | 24.7 | 2,757.39 | |
| 2016.4 | 4,821.88 | 28.14% | 61.95 | 0 | 42.22 | 194.08 | 172.94 | 0 | 4,350.69 | |
| 2016.3 | 3,762.93 | -32.77% | 17 | 0 | 129.89 | 48.88 | 246.58 | 1.5 | 3,319.08 | |
| 2016.2 | 5,597.31 | 196.40% | 5.88 | 0 | 0 | 89.47 | 2,587.57 | 42.39 | 2,872.01 | |
| 2016.1 | 1,888.44 | -50.51% | 84.01 | 0 | 0 | 24.4 | 167.67 | 1.2 | 1,611.15 | |
| 2015.4 | 3,815.50 | 170.03% | 110.04 | 6.25 | 5.2 | 146.38 | 423.06 | 47.99 | 3,076.58 | |
| 2015.3 | 1,413.00 | -34.83% | 0 | 0 | 0 | 74.9 | 233.4 | 1.55 | 1,103.15 | |
| 2015.2 | 2,168.31 | 5.68% | 34 | 0 | 0 | 91.24 | 67.75 | 0 | 1,975.32 | |
| 2015.1 | 2,051.83 | -28.67% | 0.75 | 0 | 16 | 104.25 | 7 | 25.26 | 1,898.57 | |
| 2014.4 | 2,876.40 | 26.39% | 50.6 | 29.3 | 1.23 | 1.38 | 26.33 | 0 | 2,767.58 | |
| 2014.3 | 2,275.73 | -20.86% | 20.68 | 0 | 0 | 83.19 | 73.84 | 0 | 2,098.03 | |
| 2014.2 | 2,875.53 | 47.57% | 3.2 | 55 | 0 | 321.01 | 175.87 | 37.93 | 2,282.52 | |
| 2014.1 | 1,948.52 | 11.06% | 3.99 | 0 | 0 | 203.84 | 256.16 | 0 | 1,484.53 | |
| 2013.4 | 1,754.46 | -57.36% | 36.25 | 0 | 0 | 273.11 | 258.04 | 20 | 1,167.07 | |
| 2013.3 | 4,114.49 | 58.48% | 87.66 | 0 | 18.03 | 565.03 | 141.15 | 139.19 | 3,163.44 | |
| 2013.2 | 2,596.20 | -20.78% | 73.94 | 20 | 0 | 266.78 | 92.68 | 0 | 2,142.80 | |
| 2013.1 | 3,277.23 | 99.35 | 0 | 5.94 | 142.07 | 186.46 | 0 | 2,843.41 |
Economic Indicator
To download, right click on the chart and select “Save Image As”…
*Note: Others include Vehicles, Tobacco, Clothing, Heavy Equipment & All Others; Prior to 2006 Others also included Food Items, Construction Materials, & Beverages; Values are rounded to the nearest Hundredths; Shipments between Islands are not counted
* = Year to Date
*Note: Others include Vehicles, Tobacco, Clothing, Heavy Equipment & All Others; Prior to 2006 Others also included Food Items, Construction Materials, & Beverages; Values are rounded to the nearest Hundredths; Shipments between Islands are not counted
** = Data not available at time of release