


Economic Indicator
Economic Indicator (EI) Data as it relates to Imports, quarters 1 through 4. Imports Annual Reports are reflected off the 4th Quarter of their respected Year
Economic Indicator
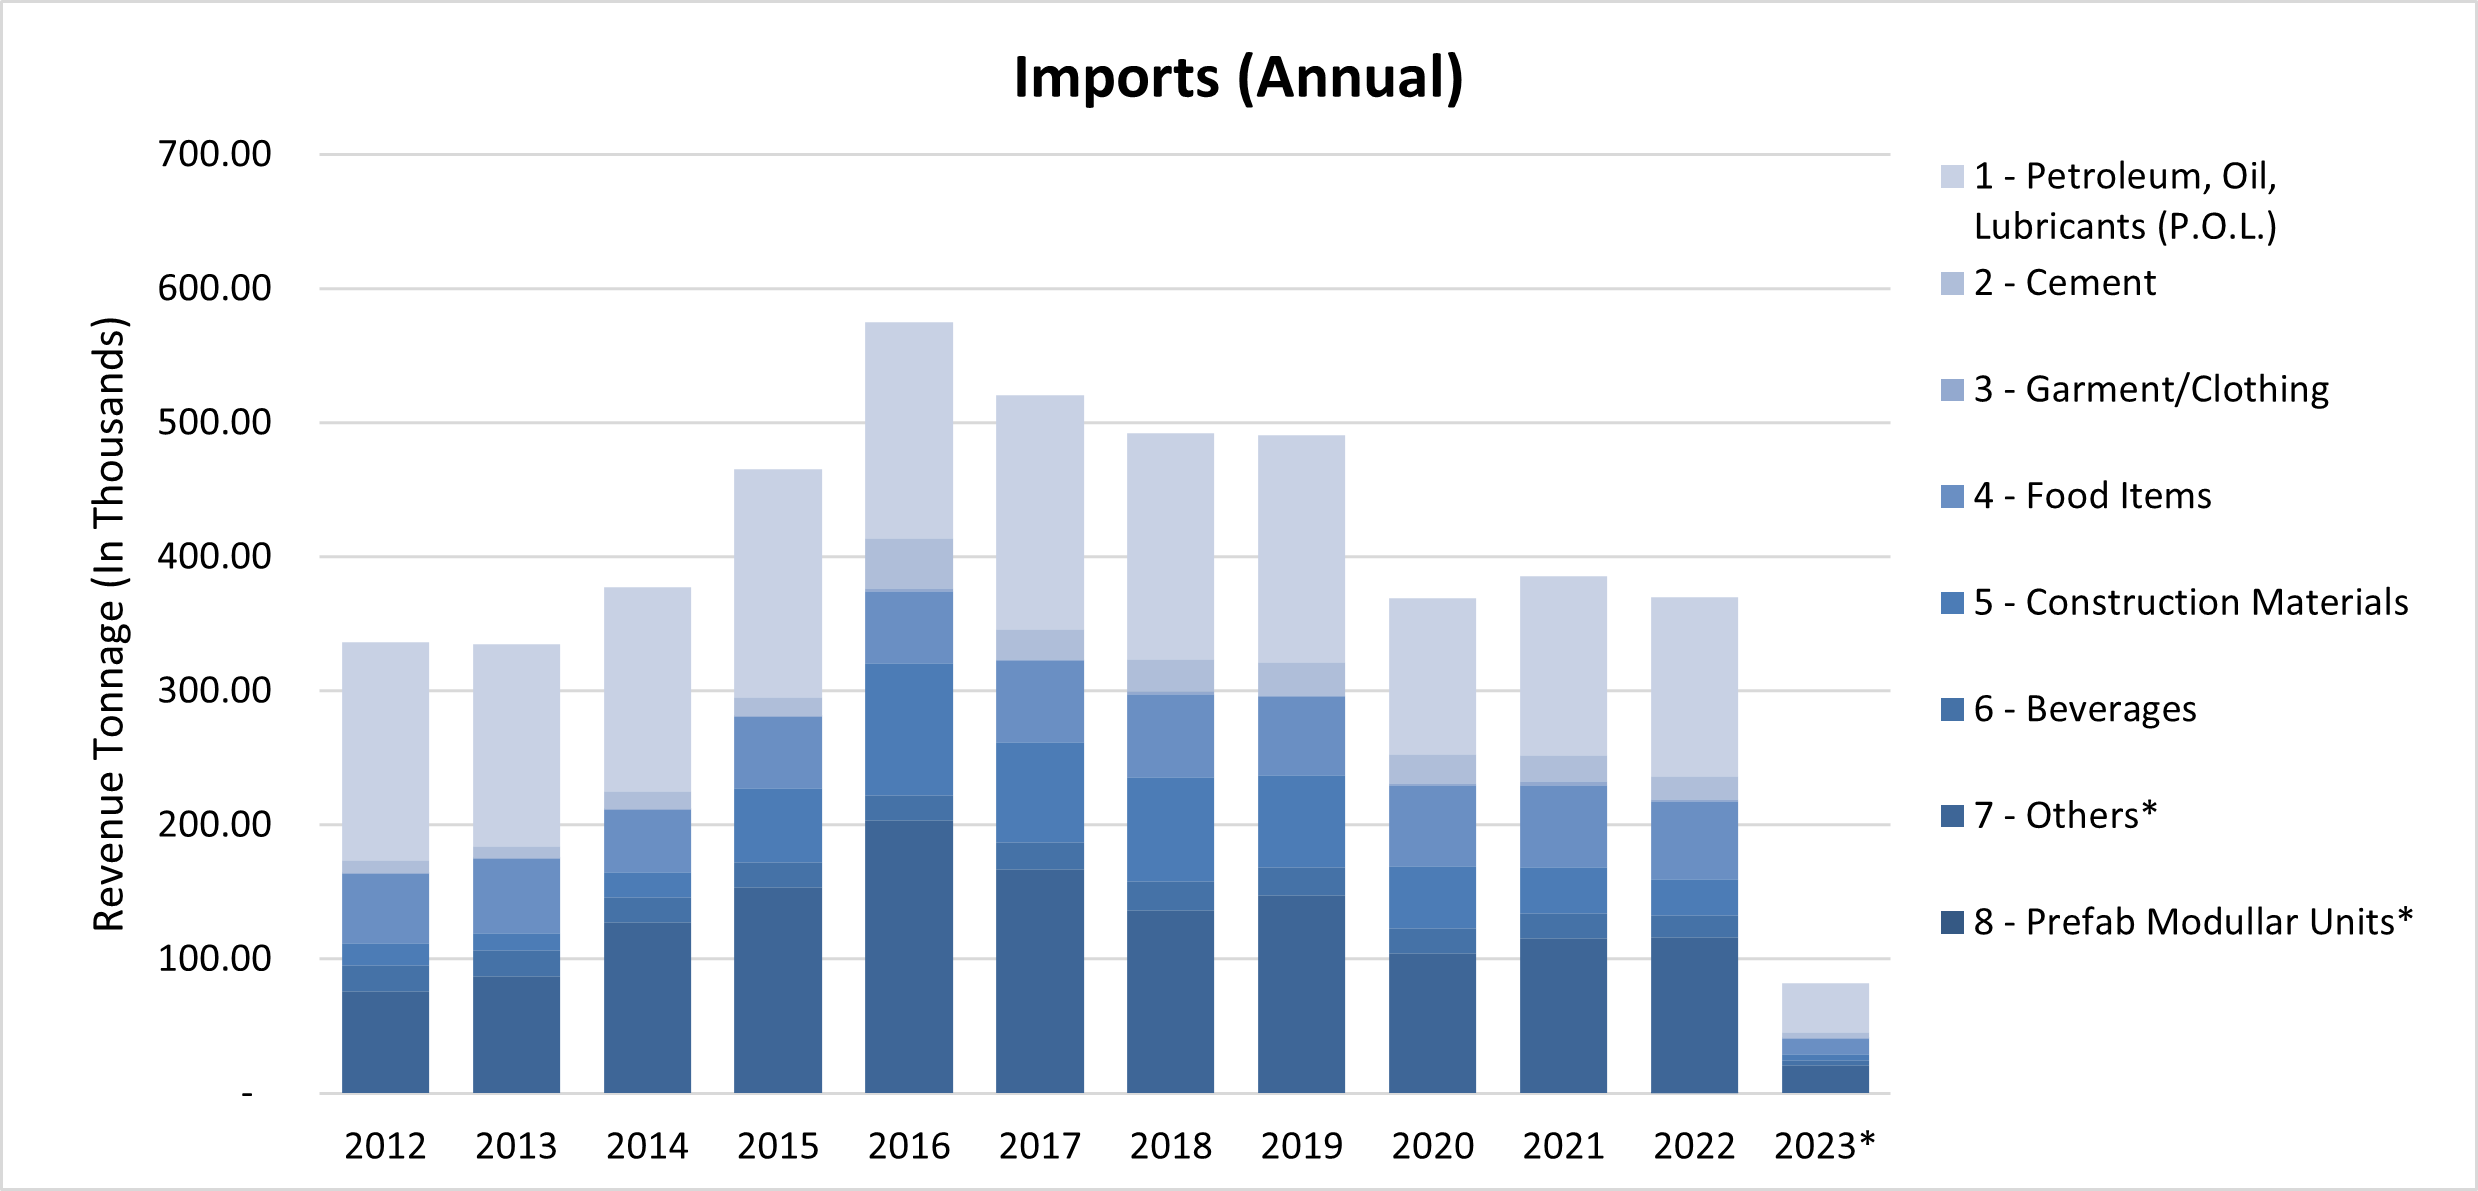
EI Import (Annual)
Import Annual Economic Indicator
Source: Port of Saipan, Commonwealth Ports Authority (CPA)
Note: Others include Vehicles, Tobacco, Clothing, Heavy Equipment & All Others; Prior to 2006 Others also included Food Items, Construction Materials, & Beverages
*Values are rounded to the nearest Hundredths
*Shipments between Islands are not included
| Total Revenue Tonnage (In Thousands) | % Change to Previous Quarter | 1 – Petroleum, Oil, Lubricants (P.O.L.) | 2 – Cement | 3 – Garment | 4 – Food Items | 5 – Construction Materials | 6 – Beverages | 7 – Others* | 8 – Prefab Modullar Units* | |
|---|---|---|---|---|---|---|---|---|---|---|
| Source: CNMI Economic Indicators / CSD | ||||||||||
| 2023* | 81.77 | -29.90% | 36.10563 | 4.24952 | 0.11643 | 12.42763 | 4.58454 | 3.11931 | 21.16841 | 0 |
| 2022 | 369.63 | -4.00% | 132.96 | 17.33 | 1.39 | 58.46 | 26.67 | 16.08 | 116.69 | 0.06 |
| 2021 | 385.54 | 4.00% | 133.15 | 19.46 | 3.02 | 61.65 | 33.8 | 18.64 | 115.83 | |
| 2020 | 369.17 | -25.00% | 116.49 | 21.64 | 1.37 | 60.35 | 46.12 | 18.45 | 104.74 | |
| 2019 | 490.62 | 0.00% | 169.26 | 24.74 | 0.34 | 59.4 | 68.53 | 20.88 | 147.47 | |
| 2018 | 492.03 | -6.00% | 168.53 | 23.79 | 2.14 | 61.58 | 77.79 | 21.58 | 136.62 | |
| 2017 | 520.77 | -9.00% | 174.64 | 22.66 | 0.74 | 60.79 | 74.87 | 19.79 | 167.28 | |
| 2016 | 575.30 | 24.00% | 161.36 | 37.59 | 2.19 | 53.26 | 98.55 | 18.89 | 203.47 | |
| 2015 | 465.62 | 23.00% | 170.56 | 13.7 | 0.23 | 53.31 | 55.35 | 19.03 | 153.43 | |
| 2014 | 377.72 | 13.00% | 152.14 | 14.01 | 0 | 46.88 | 18.4 | 18.67 | 127.62 | |
| 2013 | 334.58 | -1.00% | 150.1 | 9.48 | 0.08 | 55.64 | 12.63 | 19.45 | 87.21 | |
| 2012 | 336.40 | -4.00% | 162.39 | 9.76 | 0.26 | 52.25 | 16.1 | 19.62 | 76.01 | |
| 2011 | 349.51 | 0.00% | 183.16 | 9.11 | 0.22 | 44.22 | 15.36 | 19.61 | 77.84 | |
| 2010 | 349.45 | 4.00% | 164.27 | 13.26 | 0.52 | 47.5 | 13.87 | 20.39 | 89.64 | |
| 2009 | 334.42 | -6.00% | 153.61 | 11.54 | 0.55 | 47.78 | 14.5 | 20.97 | 85.49 | |
| 2008 | 356.35 | -19.00% | 145.3 | 21.31 | 12.63 | 49.37 | 16.86 | 20.3 | 90.6 | |
| 2007 | 439.44 | -19.00% | 175.99 | 27.15 | 52.72 | 53.53 | 14.9 | 20.66 | 94.49 |
EI Import (Quarterly)
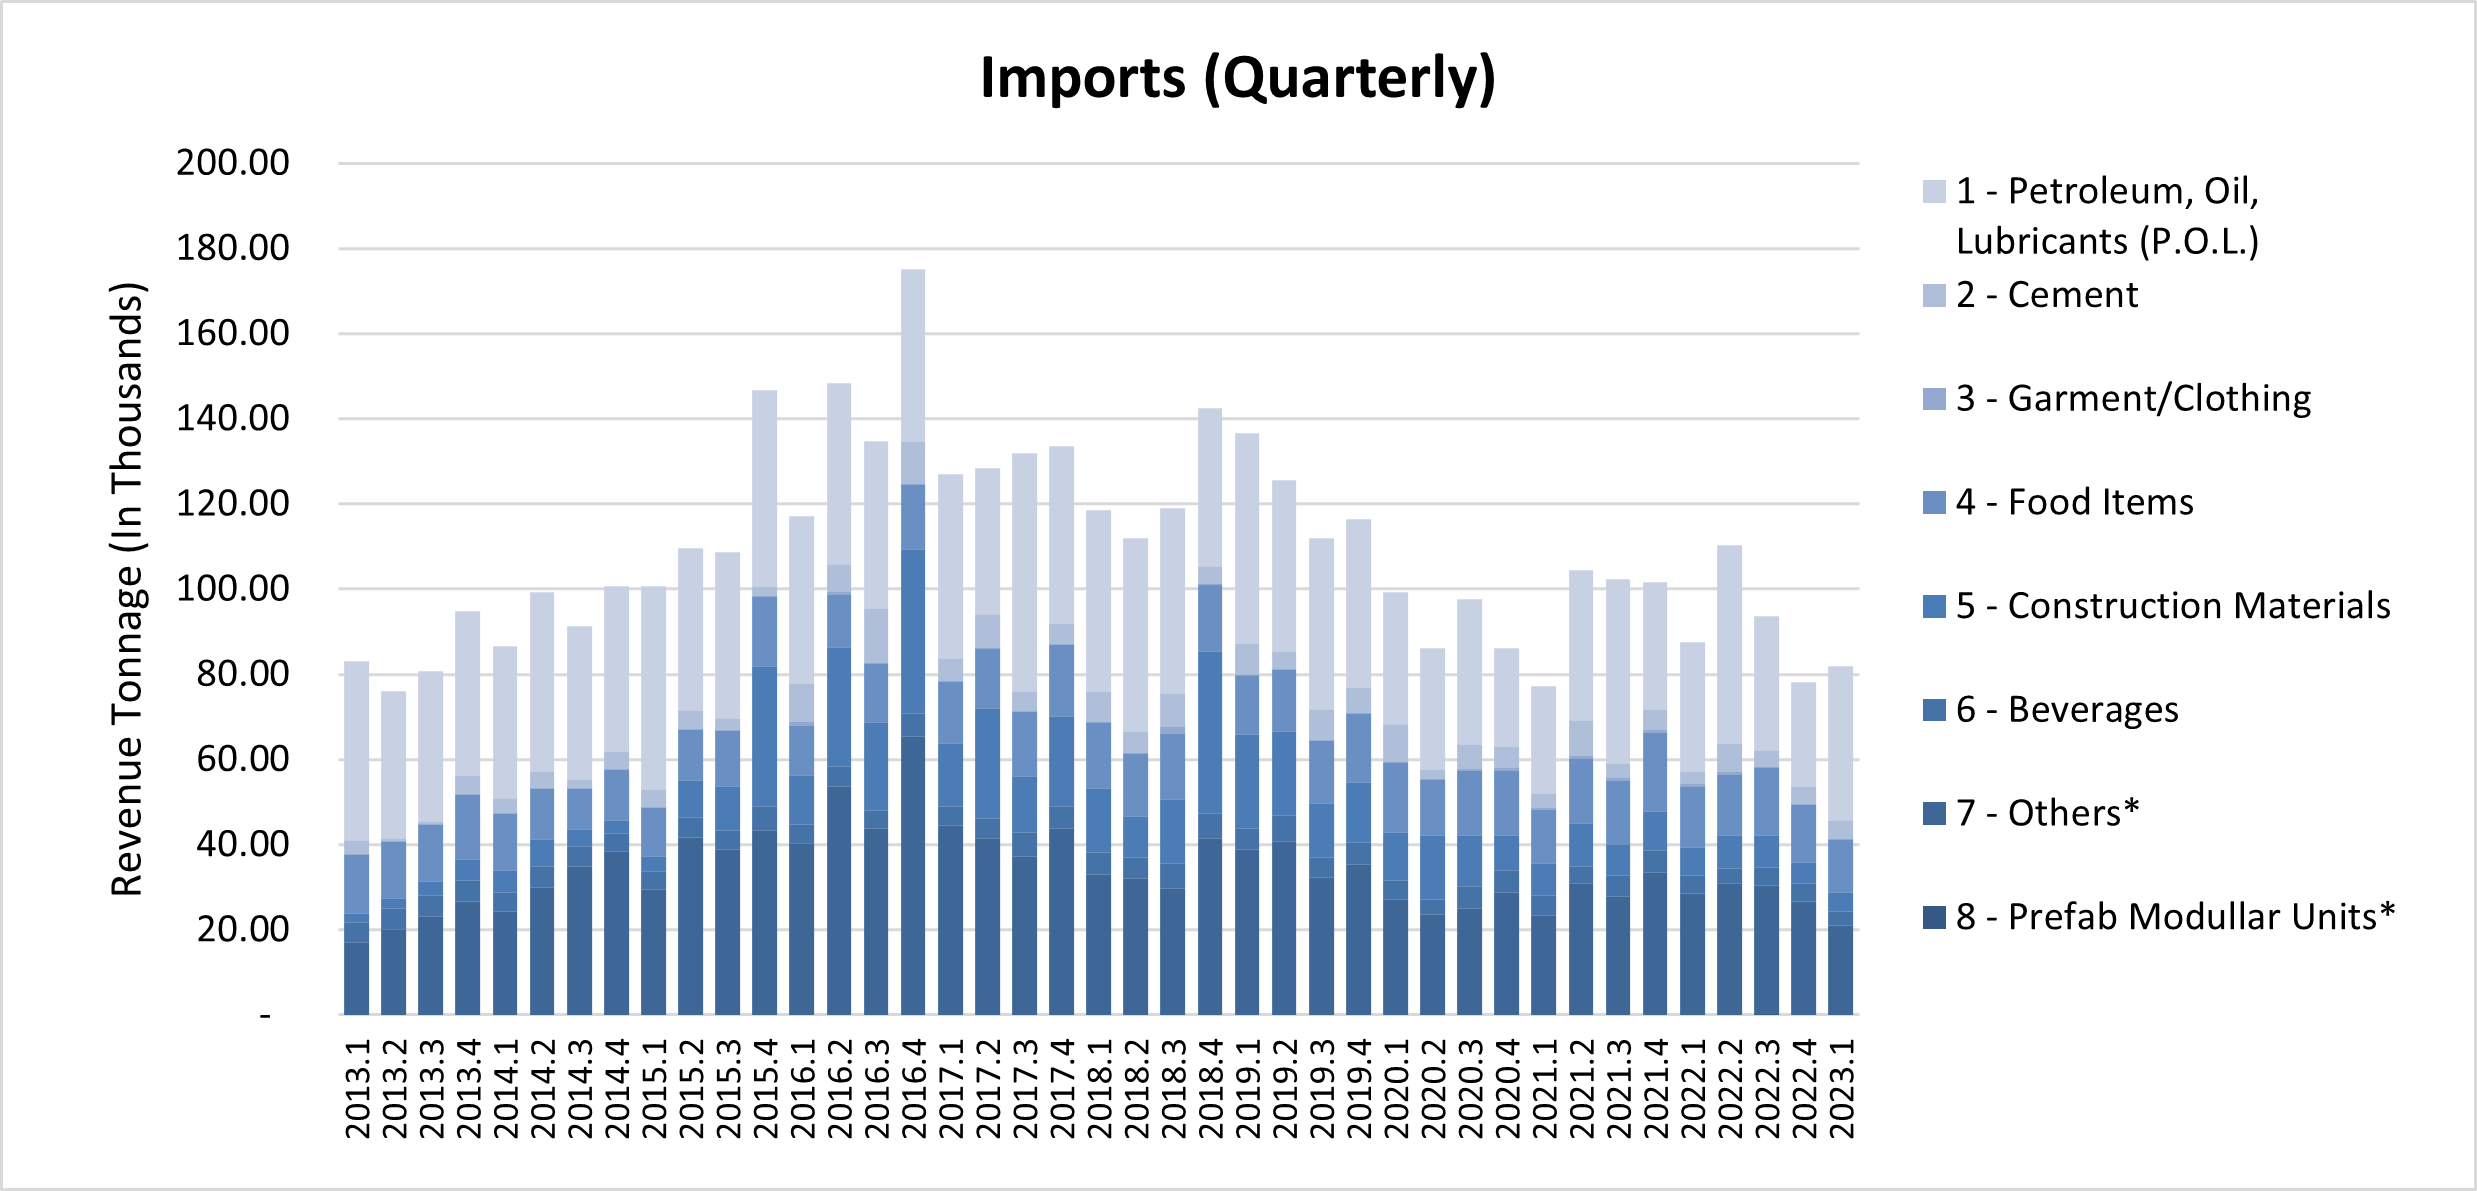
Import Quarterly Economic Indicator
Source: Port of Saipan, Commonwealth Ports Authority (CPA)
Note: Others include Vehicles, Tobacco, Clothing, Heavy Equipment & All Others; Prior to 2006 Others also included Food Items, Construction Materials, & Beverages
*Values are rounded to the nearest Hundredths
*Shipments between Islands are not included
| Total Revenue Tonnage (In Thousands) | % Change to Previous Quarter | 1 – Petroleum, Oil, Lubricants (P.O.L.) | 2 – Cement | 3 – Garment | 4 – Food Items | 5 – Construction Materials | 6 – Beverages | 7 – Others* | 8 – Prefab Modullar Units* | |
|---|---|---|---|---|---|---|---|---|---|---|
| Source: CNMI Economic Indicators / CSD | ||||||||||
| 2023.1 | 81.77 | 4.57% | 36.10563 | 4.24952 | 0.11643 | 12.42763 | 4.58454 | 3.11931 | 21.16841 | 0 |
| 2022.4 | 78.20 | -16.46% | 24.51 | 4.21 | 0.05 | 13.51 | 5.1 | 4.21 | 26.62 | 0 |
| 2022.3 | 93.61 | -15.16% | 31.53 | 3.63 | 0.2 | 16.09 | 7.36 | 4.25 | 30.49 | 0.06 |
| 2022.2 | 110.34 | 26.11% | 46.58 | 6.64 | 0.55 | 14.46 | 7.74 | 3.48 | 30.89 | |
| 2022.1 | 87.49 | -13.98% | 30.34 | 2.85 | 0.59 | 14.41 | 6.47 | 4.15 | 28.68 | |
| 2021.4 | 101.71 | -0.61% | 29.92 | 4.59 | 0.92 | 18.55 | 8.97 | 5.14 | 33.62 | |
| 2021.3 | 102.34 | -1.93% | 43.15 | 3.29 | 0.82 | 15.07 | 7.15 | 4.99 | 27.86 | |
| 2021.2 | 104.34 | 35.26% | 35.1 | 8.28 | 0.64 | 15.4 | 10.09 | 3.95 | 30.89 | |
| 2021.1 | 77.15 | -10.52% | 24.98 | 3.3 | 0.64 | 12.64 | 7.58 | 4.55 | 23.46 | |
| 2020.4 | 86.21 | -11.68% | 23.08 | 5.08 | 0.56 | 15.39 | 8.16 | 5.21 | 28.74 | |
| 2020.3 | 97.61 | 13.39% | 33.98 | 5.68 | 0.47 | 15.26 | 11.91 | 5.25 | 25.06 | |
| 2020.2 | 86.08 | -13.27% | 28.43 | 2.15 | 0.08 | 13.33 | 14.87 | 3.55 | 23.68 | |
| 2020.1 | 99.26 | -14.76% | 31 | 8.73 | 0.27 | 16.37 | 11.19 | 4.43 | 27.27 | |
| 2019.4 | 116.44 | 4.08% | 39.58 | 5.88 | 0.06 | 16.25 | 14.03 | 5.14 | 35.5 | |
| 2019.3 | 111.88 | -10.93% | 40.09 | 7.38 | 0 | 14.72 | 12.76 | 4.68 | 32.25 | |
| 2019.2 | 125.60 | -8.13% | 40.09 | 4.33 | 0.02 | 14.54 | 19.64 | 6.26 | 40.71 | |
| 2019.1 | 136.71 | -4.08% | 49.5 | 7.14 | 0.25 | 13.89 | 22.11 | 4.8 | 39.01 | |
| 2018.4 | 142.53 | 19.74% | 37.14 | 4.09 | 0.14 | 15.8 | 38.01 | 5.74 | 41.6 | |
| 2018.3 | 119.03 | 6.33% | 43.54 | 7.7 | 1.64 | 15.41 | 15.2 | 5.8 | 29.75 | |
| 2018.2 | 111.95 | -5.54% | 45.42 | 4.82 | 0.23 | 14.93 | 9.45 | 4.98 | 32.13 | |
| 2018.1 | 118.51 | -11.21% | 42.43 | 7.18 | 0.13 | 15.43 | 15.14 | 5.06 | 33.14 | |
| 2017.4 | 133.48 | 1.26% | 41.44 | 4.94 | 0.16 | 16.74 | 21.13 | 5.26 | 43.82 | |
| 2017.3 | 131.82 | 2.65% | 55.74 | 4.66 | 0.14 | 15.14 | 13.33 | 5.45 | 37.35 | |
| 2017.2 | 128.42 | 1.07% | 34.24 | 7.8 | 0.25 | 14.21 | 25.67 | 4.78 | 41.46 | |
| 2017.1 | 127.06 | -27.45% | 43.22 | 5.26 | 0.18 | 14.7 | 14.74 | 4.29 | 44.66 | |
| 2016.4 | 175.13 | 30.06% | 40.39 | 9.81 | 0.3 | 15.29 | 38.42 | 5.54 | 65.38 | |
| 2016.3 | 134.66 | -9.28% | 39.14 | 12.63 | 0.28 | 13.85 | 20.64 | 4.19 | 43.93 | |
| 2016.2 | 148.43 | 26.77% | 42.59 | 6.34 | 0.71 | 12.36 | 27.94 | 4.7 | 53.8 | |
| 2016.1 | 117.08 | -20.13% | 39.24 | 8.82 | 0.9 | 11.77 | 11.54 | 4.45 | 40.36 | |
| 2015.4 | 146.60 | 34.93% | 45.96 | 2.18 | 0.1 | 16.5 | 32.78 | 5.73 | 43.35 | |
| 2015.3 | 108.65 | -0.91% | 38.89 | 2.85 | 0.02 | 13.17 | 10.36 | 4.45 | 38.9 | |
| 2015.2 | 109.64 | 8.84% | 37.98 | 4.52 | 0.03 | 12.05 | 8.71 | 4.69 | 41.67 | |
| 2015.1 | 100.74 | 0.03% | 47.73 | 4.15 | 0.08 | 11.59 | 3.5 | 4.17 | 29.52 | |
| 2014.4 | 100.71 | 10.46% | 38.7 | 4.3 | 0 | 11.9 | 3.03 | 4.29 | 38.48 | |
| 2014.3 | 91.17 | -8.13% | 35.85 | 2.18 | 0 | 9.63 | 3.82 | 4.72 | 34.98 | |
| 2014.2 | 99.24 | 14.61% | 41.94 | 3.95 | 0 | 12.03 | 6.37 | 5.05 | 29.91 | |
| 2014.1 | 86.59 | -8.69% | 35.66 | 3.56 | 0 | 13.33 | 5.18 | 4.61 | 24.25 | |
| 2013.4 | 94.84 | 17.60% | 38.48 | 4.48 | 0 | 15.4 | 4.87 | 4.84 | 26.76 | |
| 2013.3 | 80.64 | 6.02% | 35.12 | 0.79 | 0.06 | 13.31 | 3.33 | 4.84 | 23.19 | |
| 2013.2 | 76.06 | -8.40% | 34.46 | 0.85 | 0.02 | 13.26 | 2.35 | 5.04 | 20.09 | |
| 2013.1 | 83.03 | 17.15% | 42.04 | 3.35 | 0 | 13.67 | 2.09 | 4.73 | 17.16 | |
| 2012.4 | 70.88 | -8.48% | 30.43 | 0.5 | 0.07 | 12.51 | 3.39 | 4.46 | 19.52 | |
| 2012.3 | 77.45 | -13.87% | 37.98 | 2.01 | 0 | 12.83 | 2.77 | 5.14 | 16.71 | |
| 2012.2 | 89.92 | -8.38% | 45.2 | 2.85 | 0.14 | 14.07 | 3.7 | 5.4 | 18.56 | |
| 2012.1 | 98.15 | -5.95% | 48.78 | 4.4 | 0.05 | 12.84 | 6.24 | 4.61 | 21.22 | |
| 2011.4 | 104.36 | 8.29% | 64.82 | 0.43 | 0.02 | 10.12 | 2.28 | 5.03 | 21.65 | |
| 2011.3 | 96.37 | 15.36% | 52.11 | 3.5 | 0.03 | 11.01 | 6.03 | 5.04 | 18.66 | |
| 2011.2 | 83.54 | 28.02% | 39.06 | 3.74 | 0.08 | 12.15 | 3.51 | 5.07 | 19.93 | |
| 2011.1 | 65.25 | -31.68% | 27.17 | 1.45 | 0.09 | 10.94 | 3.55 | 4.47 | 17.59 | |
| 2010.4 | 95.52 | 11.48% | 47.76 | 2.4 | 0.18 | 11.78 | 4.95 | 5.24 | 23.2 | |
| 2010.3 | 85.68 | -3.99% | 33.01 | 5.43 | 0.11 | 12.5 | 2.67 | 5.53 | 26.44 | |
| 2010.2 | 89.24 | 12.94% | 45.18 | 3.44 | 0.19 | 12.03 | 2.6 | 4.8 | 21 | |
| 2010.1 | 79.02 | -13.82% | 38.33 | 1.99 | 0.03 | 11.19 | 3.65 | 4.82 | 19 | |
| 2009.4 | 91.69 | 23.60% | 39.74 | 2.32 | 0.14 | 13.11 | 5.46 | 5.83 | 25.08 | |
| 2009.3 | 74.18 | -16.85% | 33.49 | 1.69 | 0.13 | 11.4 | 3.05 | 5.02 | 19.4 | |
| 2009.2 | 89.21 | 12.44% | 41.28 | 5.86 | 0.22 | 11.06 | 3.93 | 5.45 | 21.4 | |
| 2009.1 | 79.34 | 7.01% | 39.09 | 1.67 | 0.06 | 12.2 | 2.05 | 4.65 | 19.61 | |
| 2008.4 | 74.15 | -16.94% | 28.3 | 2.83 | 0.57 | 11.81 | 2.54 | 5.15 | 22.95 | |
| 2008.3 | 89.27 | -10.25% | 33.66 | 5.67 | 1.97 | 11.64 | 5.58 | 5.15 | 25.62 | |
| 2008.2 | 99.47 | 6.43% | 44.9 | 7.44 | 4.37 | 13.23 | 5.94 | 4.9 | 18.68 | |
| 2008.1 | 93.46 | -8.68% | 38.45 | 5.37 | 5.71 | 12.68 | 2.8 | 5.11 | 23.34 | |
| 2007.4 | 102.34 | -9.96% | 40.24 | 6.18 | 9.83 | 13.85 | 2.93 | 5.19 | 24.11 | |
| 2007.3 | 113.66 | 4.28% | 50.63 | 9.67 | 12.75 | 12.45 | 3.82 | 5.15 | 19.19 | |
| 2007.2 | 108.99 | -4.76% | 40.43 | 5.5 | 14.79 | 13.33 | 3.63 | 5.14 | 26.17 | |
| 2007.1 | 114.44 | -8.38% | 44.68 | 5.81 | 15.35 | 13.89 | 4.51 | 5.18 | 25.02 |
Economic Indicator
To download, right click on the chart and select “Save Image As”…
*Note: Others include Vehicles, Tobacco, Clothing, Heavy Equipment & All Others; Prior to 2006 Others also included Food Items, Construction Materials, & Beverages; Values are rounded to the nearest Hundredths; Shipments between Islands are not counted
*Note: Others include Vehicles, Tobacco, Clothing, Heavy Equipment & All Others; Prior to 2006 Others also included Food Items, Construction Materials, & Beverages; Values are rounded to the nearest Hundredths; Shipments between Islands are not counted