IntroTable DataCharts and Figures Data
Economic Indicator
Economic Indicator (EI) Data as it relates to Telephone Lines, quarters 1 through 4. Telephone Lines Annual Reports are reflected off the 4th Quarter of their respected Year
Economic Indicator
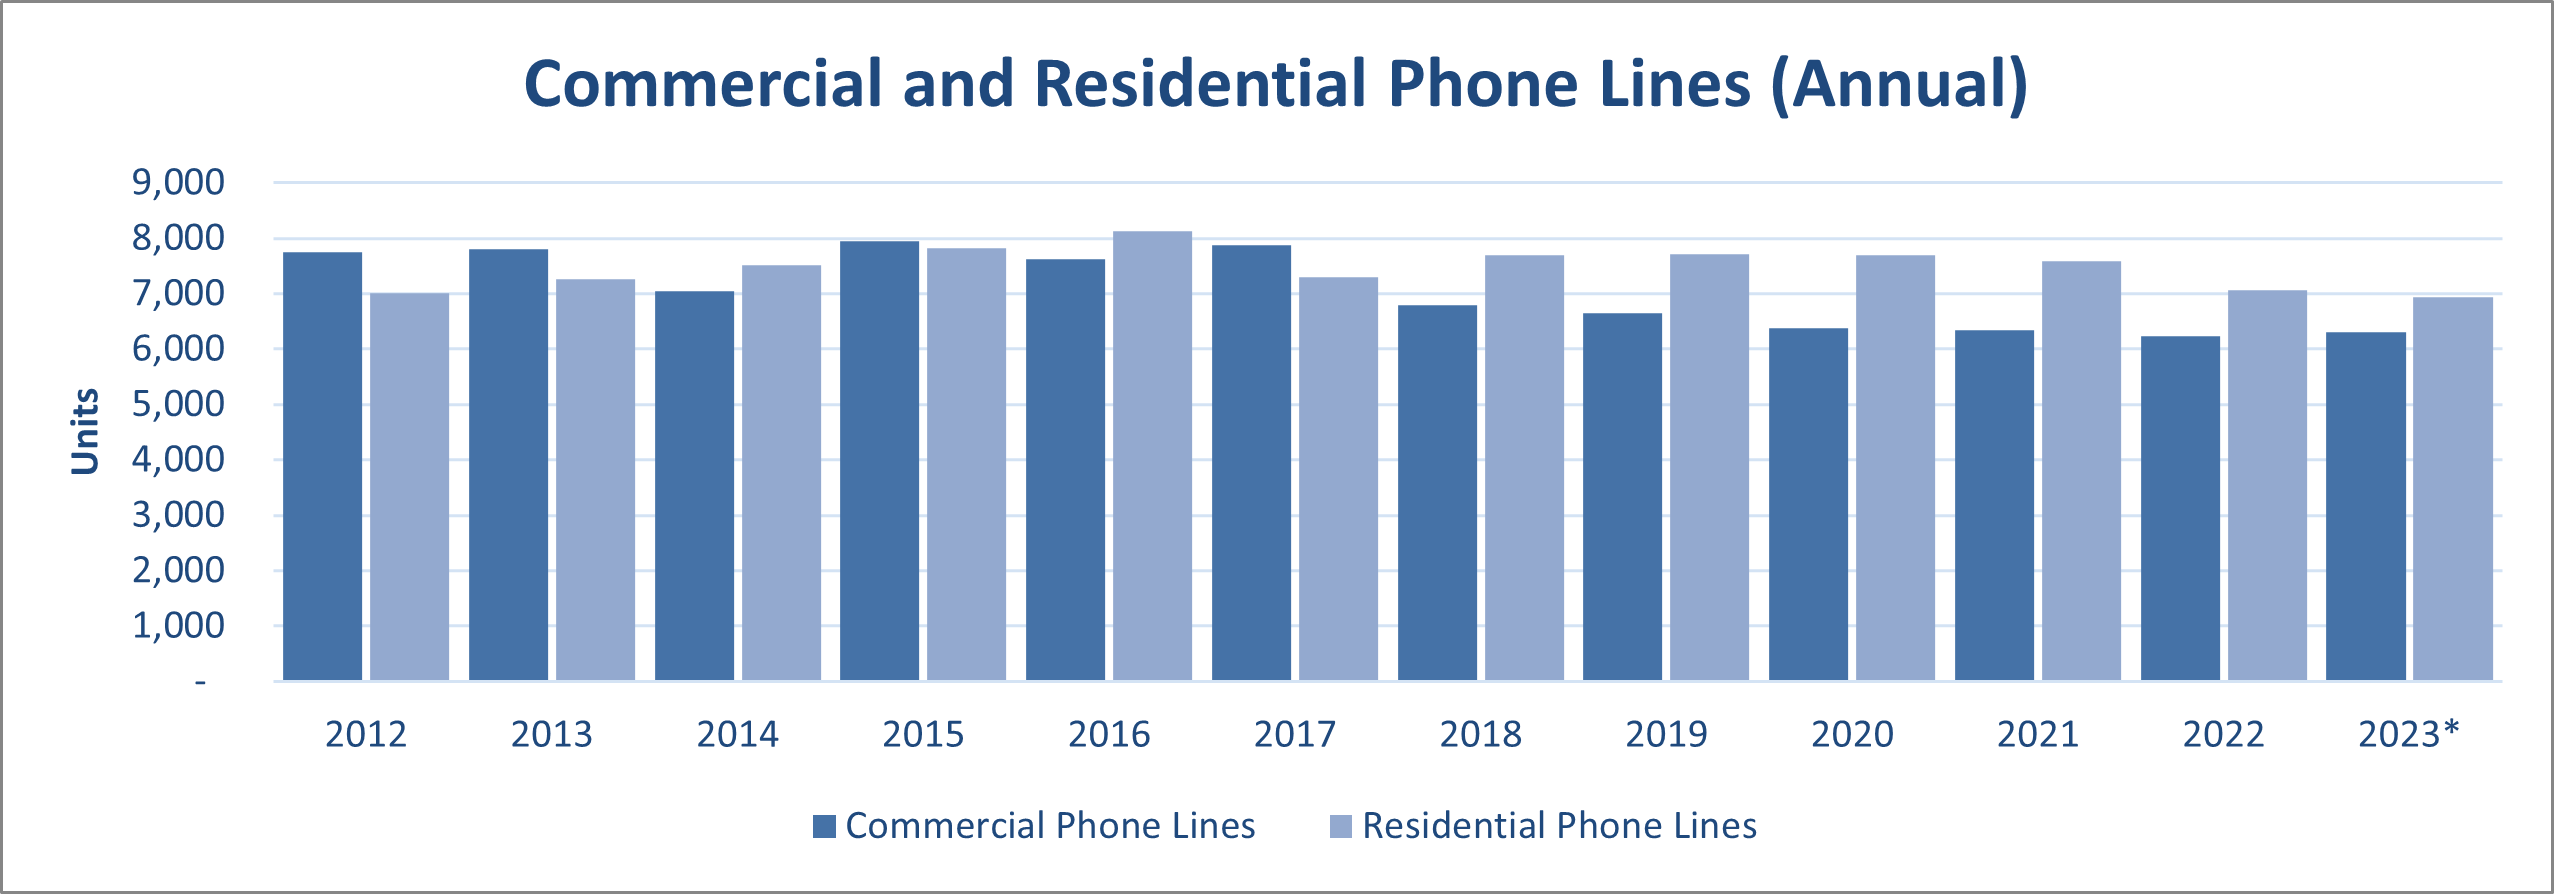
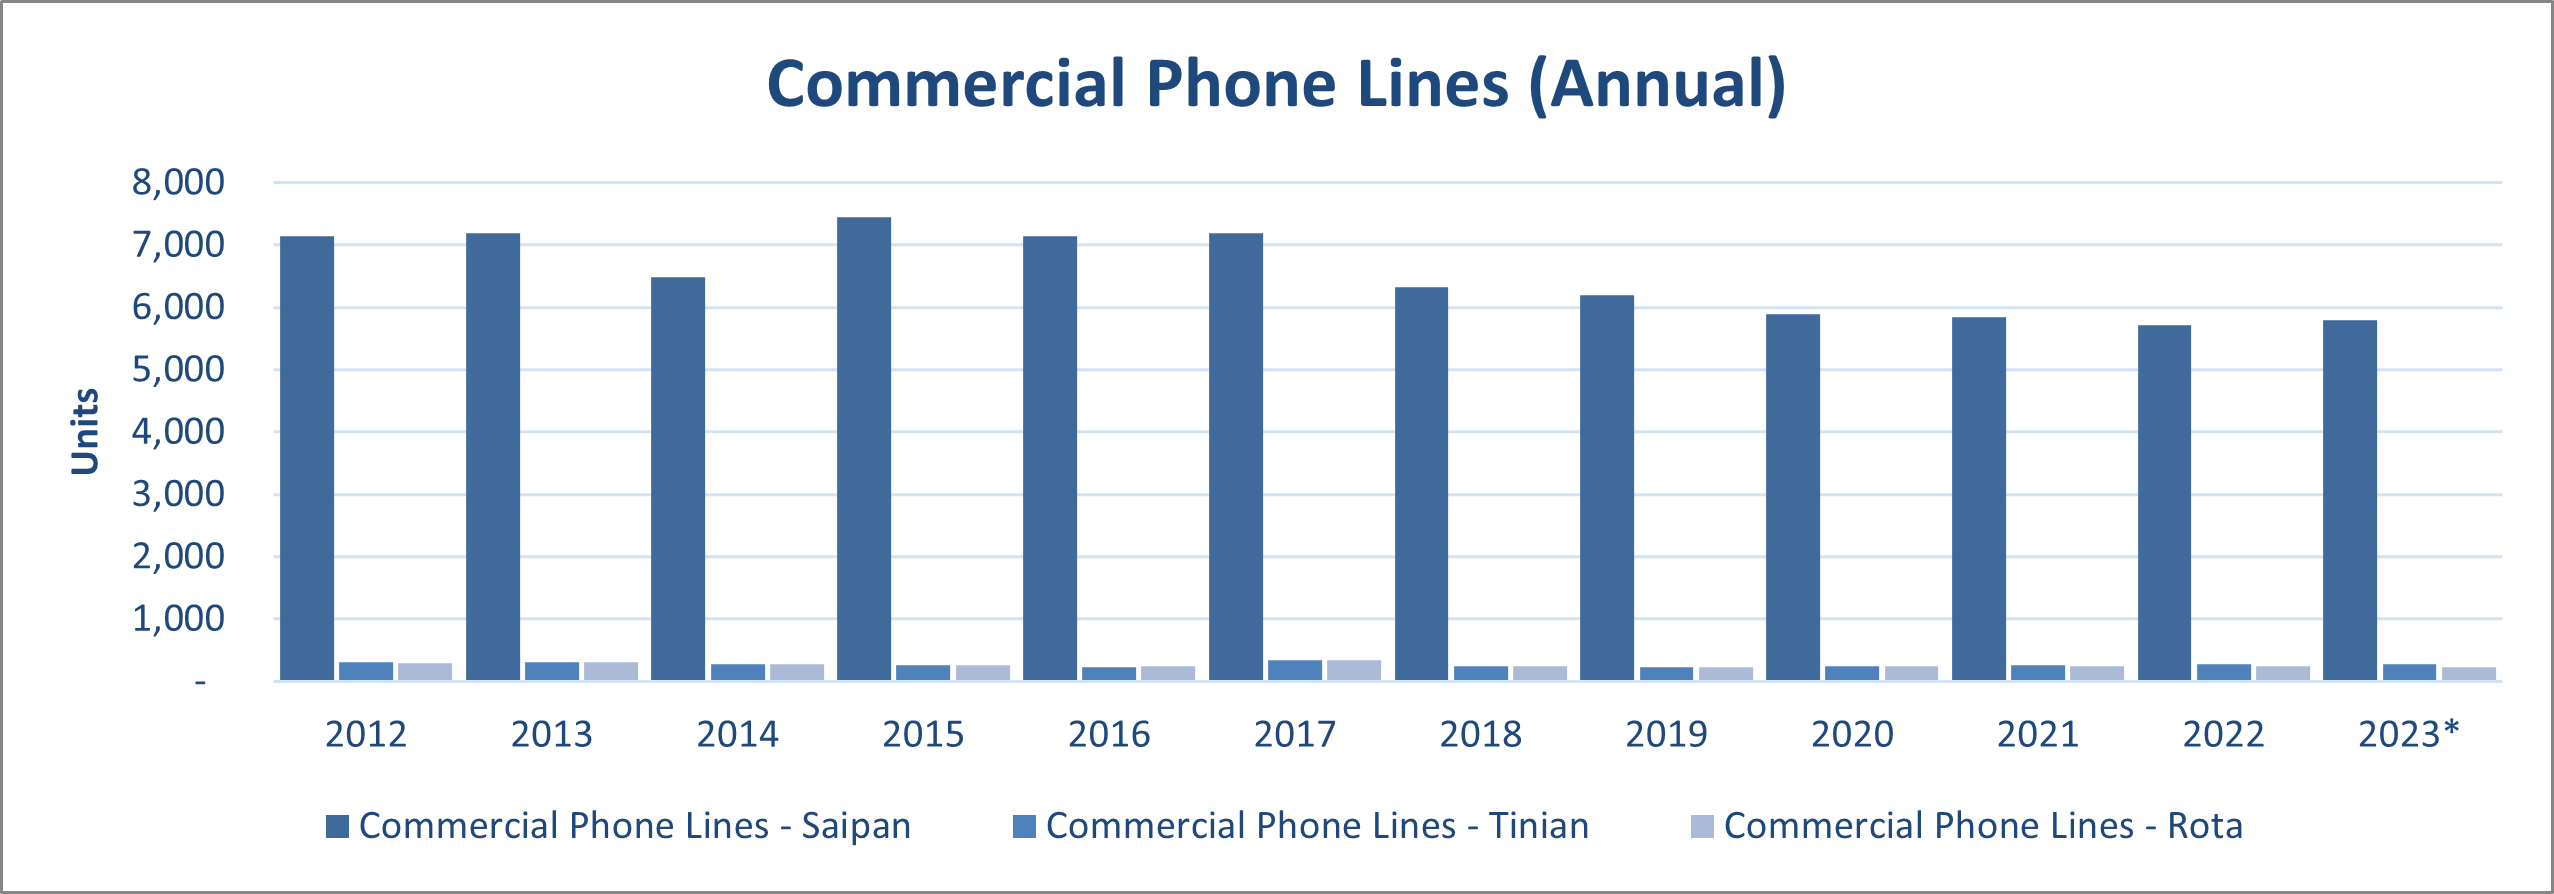
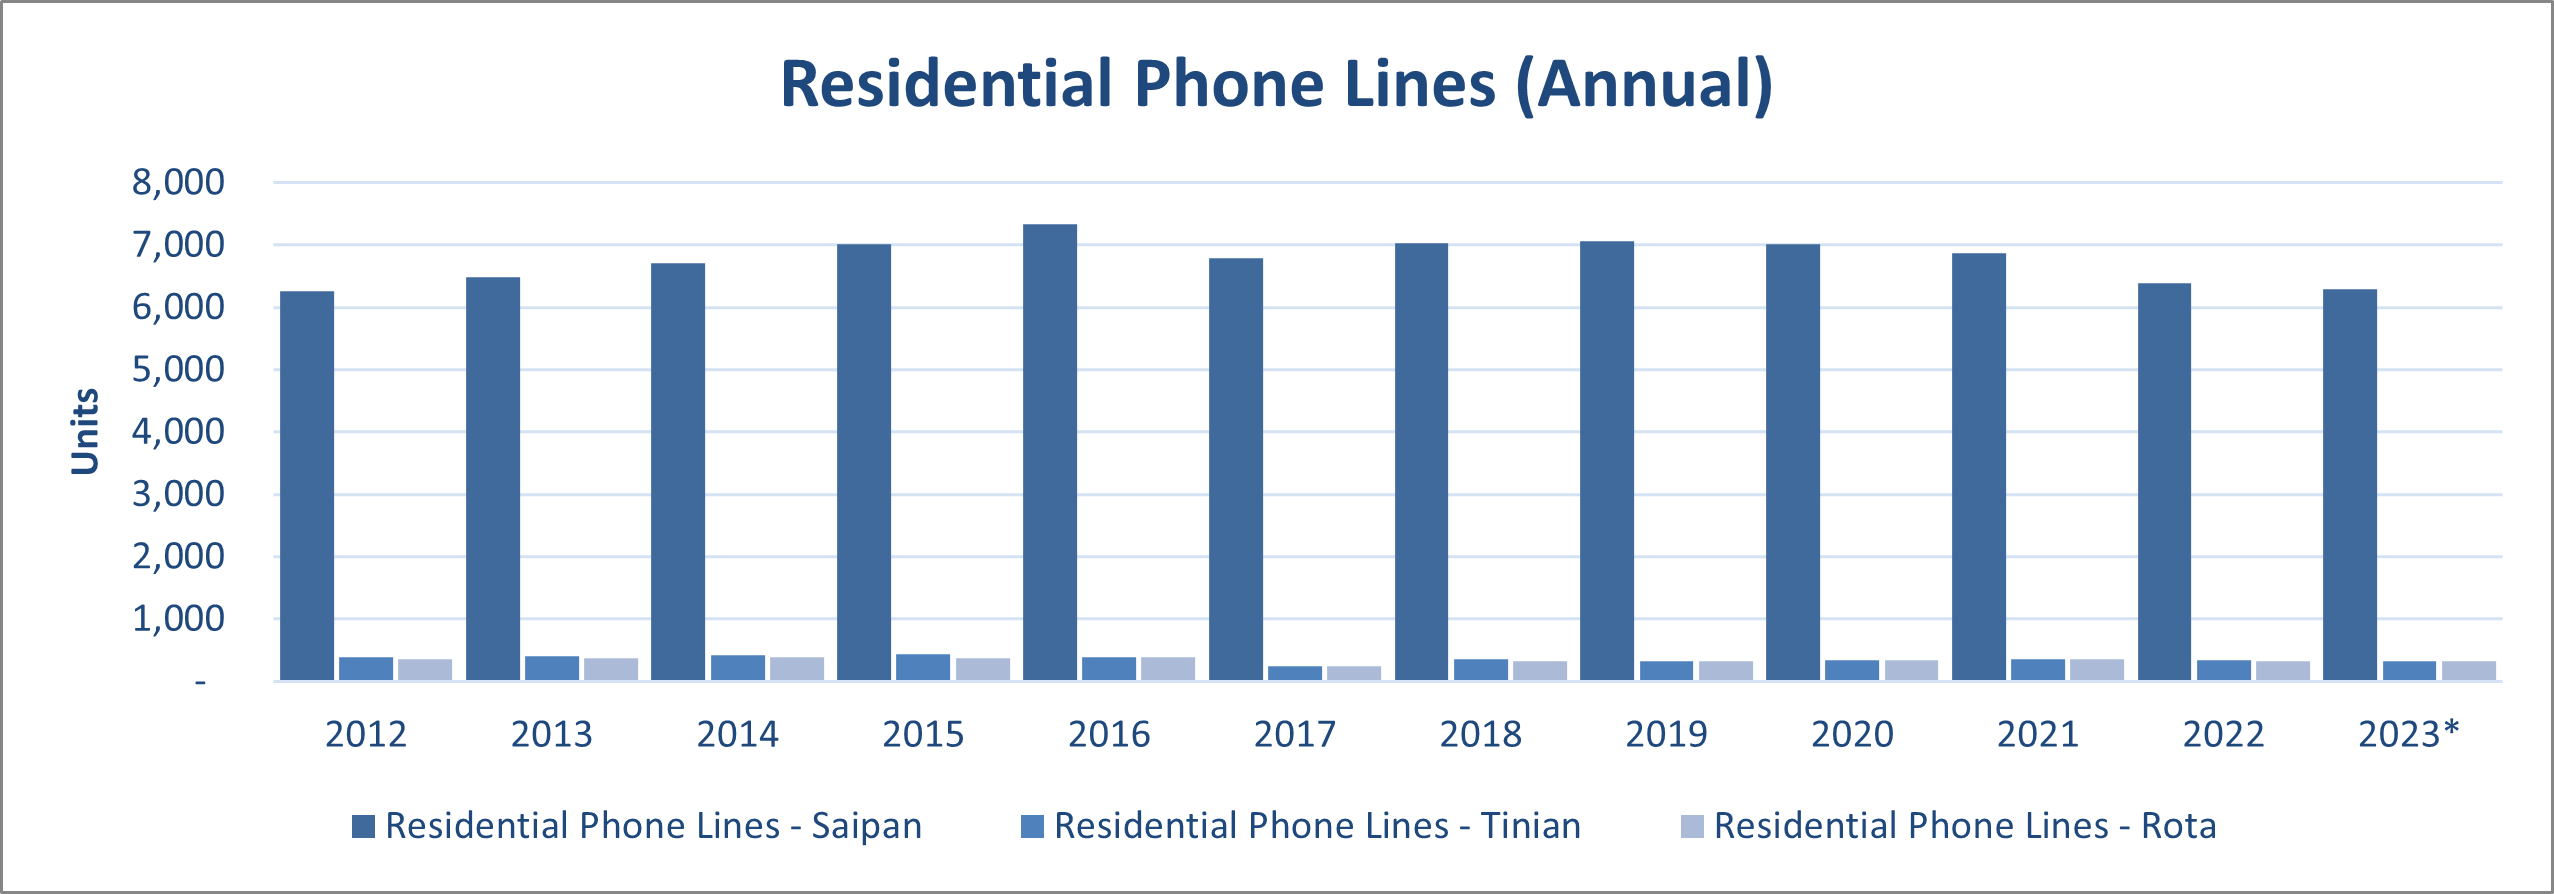
IT&E Commercial and Residential Phone Lines (Annual)
IT&E Commercial and Residential Phone Lines Annual Economic Indicator
Source: Island Telecom & Engineering (IT&E)
| Total Phone Lines | % Change from Previous Year |
Commercial Phone Lines | % Change from Previous Year |
Saipan | Tinian | Rota | Residential Phone Lines | % Change from Previous Year |
Saipan | Tinian | Rota | |
|---|---|---|---|---|---|---|---|---|---|---|---|---|
| Source: CNMI Economic Indicators / CSD | ||||||||||||
| 2023* | 13,247 | -0.39% | 6,309 | 1.15% | 5,789 | 284 | 236 | 6,938 | -1.76% | 6,290 | 330 | 318 |
| 2022 | 13,299 | -4.57% | 6,237 | -1.72% | 5,711 | 281 | 245 | 7,062 | -6.96% | 6,395 | 342 | 325 |
| 2021 | 13,936 | -1.00% | 6,346 | -0.56% | 5,838 | 260 | 248 | 7,590 | -1.36% | 6,876 | 356 | 358 |
| 2020 | 14,077 | -2.02% | 6,382 | -4.00% | 5,894 | 240 | 248 | 7,695 | -0.31% | 7,014 | 344 | 337 |
| 2019 | 14,367 | -0.88% | 6,648 | -2.19% | 6,189 | 223 | 236 | 7,719 | 0.29% | 7,069 | 327 | 323 |
| 2018 | 14,494 | -4.39% | 6,797 | -13.65% | 6,318 | 240 | 239 | 7,697 | 5.61% | 7,024 | 352 | 321 |
| 2017 | 15,159 | -3.76% | 7,871 | 3.23% | 7,193 | 345 | 333 | 7,288 | -10.31% | 6,796 | 243 | 249 |
| 2016 | 15,751 | -0.12% | 7,625 | -4.15% | 7,145 | 232 | 248 | 8,126 | 3.98% | 7,339 | 393 | 394 |
| 2015 | 15,770 | 8.36% | 7,955 | 13.00% | 7,444 | 258 | 253 | 7,815 | 4.02% | 7,010 | 429 | 376 |
| 2014 | 14,553 | -3.39% | 7,040 | -9.82% | 6,492 | 275 | 273 | 7,513 | 3.53% | 6,707 | 422 | 384 |
| 2013 | 15,064 | 2.08% | 7,807 | 0.79% | 7,199 | 306 | 302 | 7,257 | 3.51% | 6,488 | 400 | 369 |
| 2012 | 14,757 | -2.79% | 7,746 | -2.92% | 7,141 | 306 | 299 | 7,011 | -2.64% | 6,265 | 386 | 360 |
| 2011 | 15,180 | -4.22% | 7,979 | -4.24% | 7,331 | 314 | 334 | 7,201 | -4.20% | 6,477 | 368 | 356 |
| 2010 | 15,849 | -3.33% | 8,332 | -3.48% | 7,638 | 333 | 361 | 7,517 | -3.17% | 6,742 | 380 | 395 |
| 2009 | 16,395 | -5.19% | 8,632 | -3.97% | 7,913 | 356 | 363 | 7,763 | -6.50% | 6,934 | 416 | 413 |
| 2008 | 17,292 | -6.21% | 8,989 | -5.13% | 8,238 | 366 | 385 | 8,303 | -7.35% | 7,414 | 439 | 450 |
| 2007 | 18,437 | -10.69% | 9,475 | -10.21% | 8,689 | 376 | 410 | 8,962 | -11.20% | 8,045 | 458 | 459 |
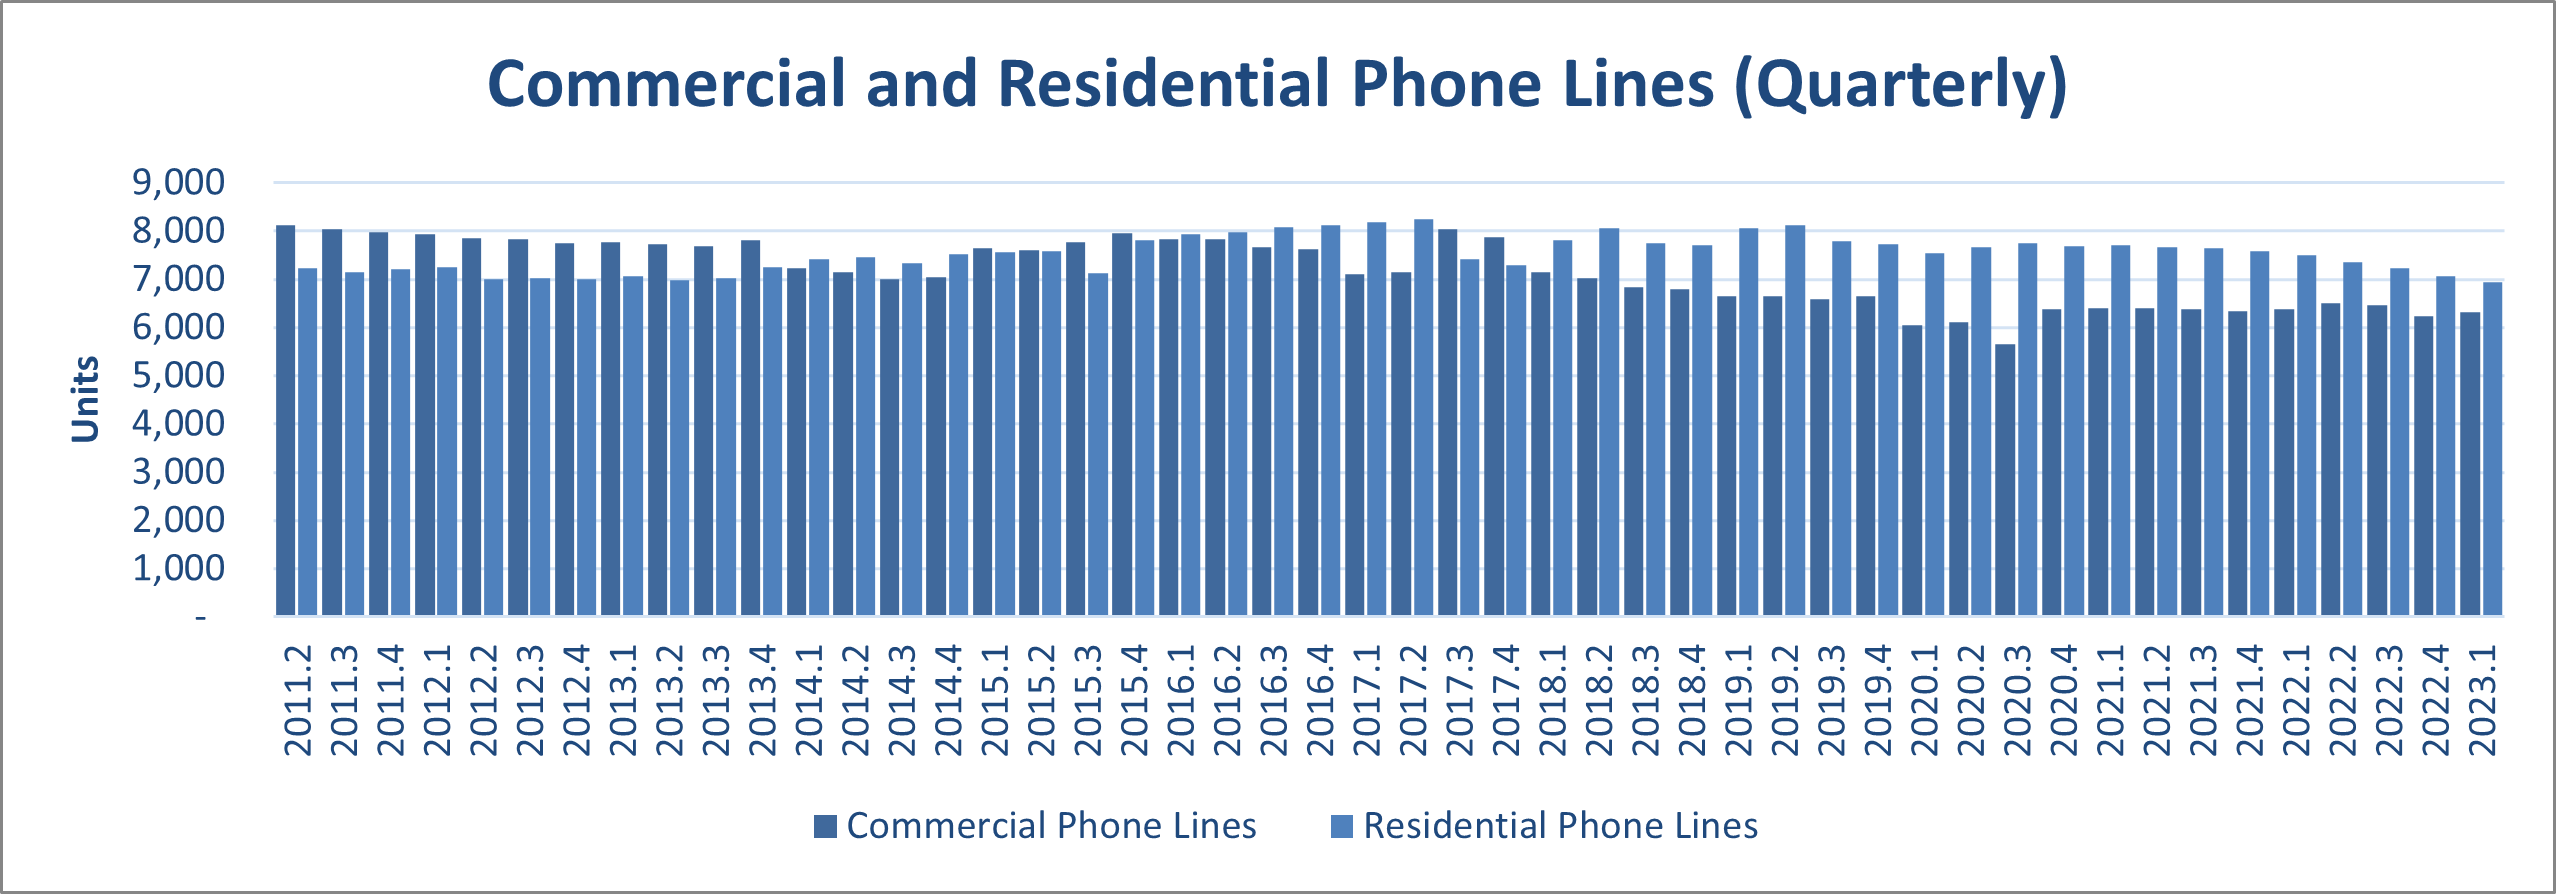
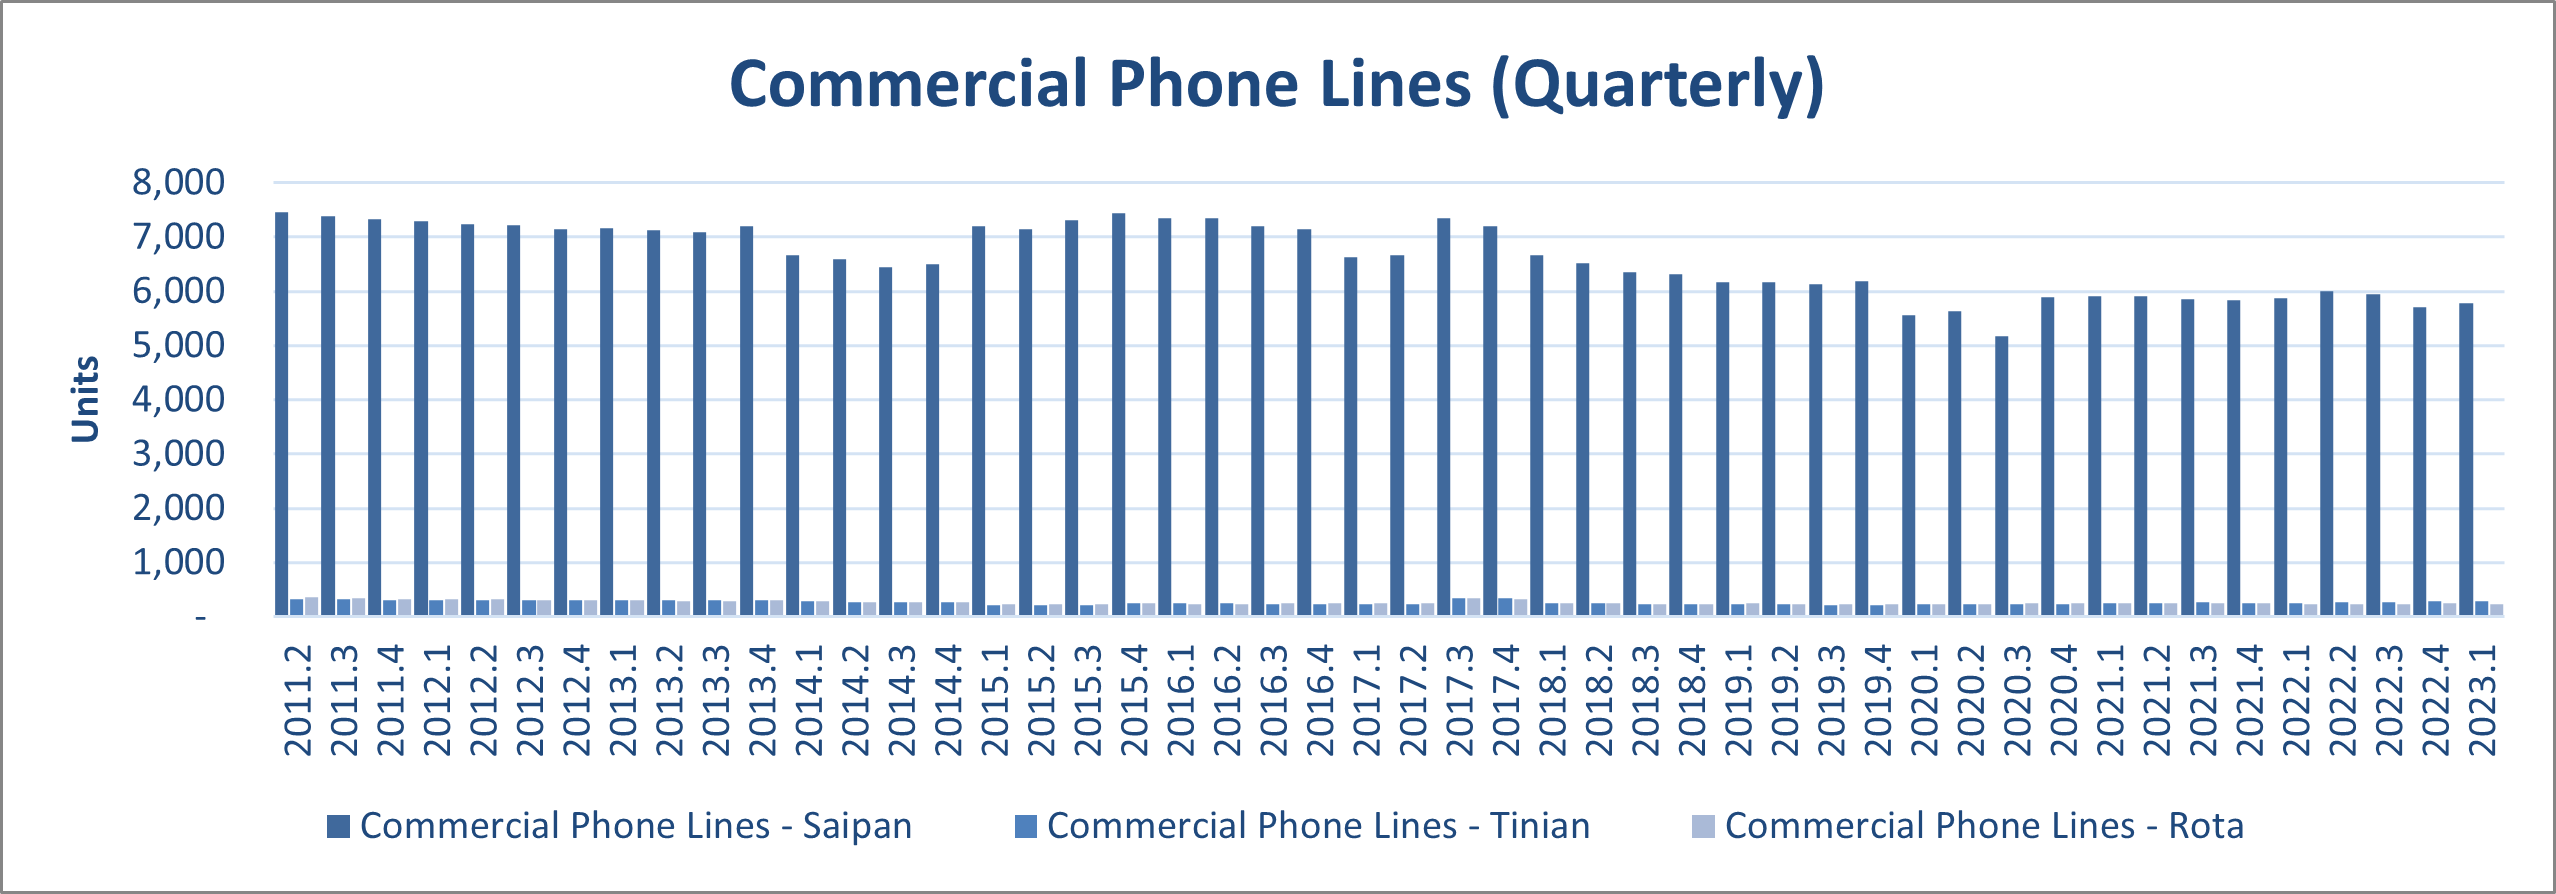
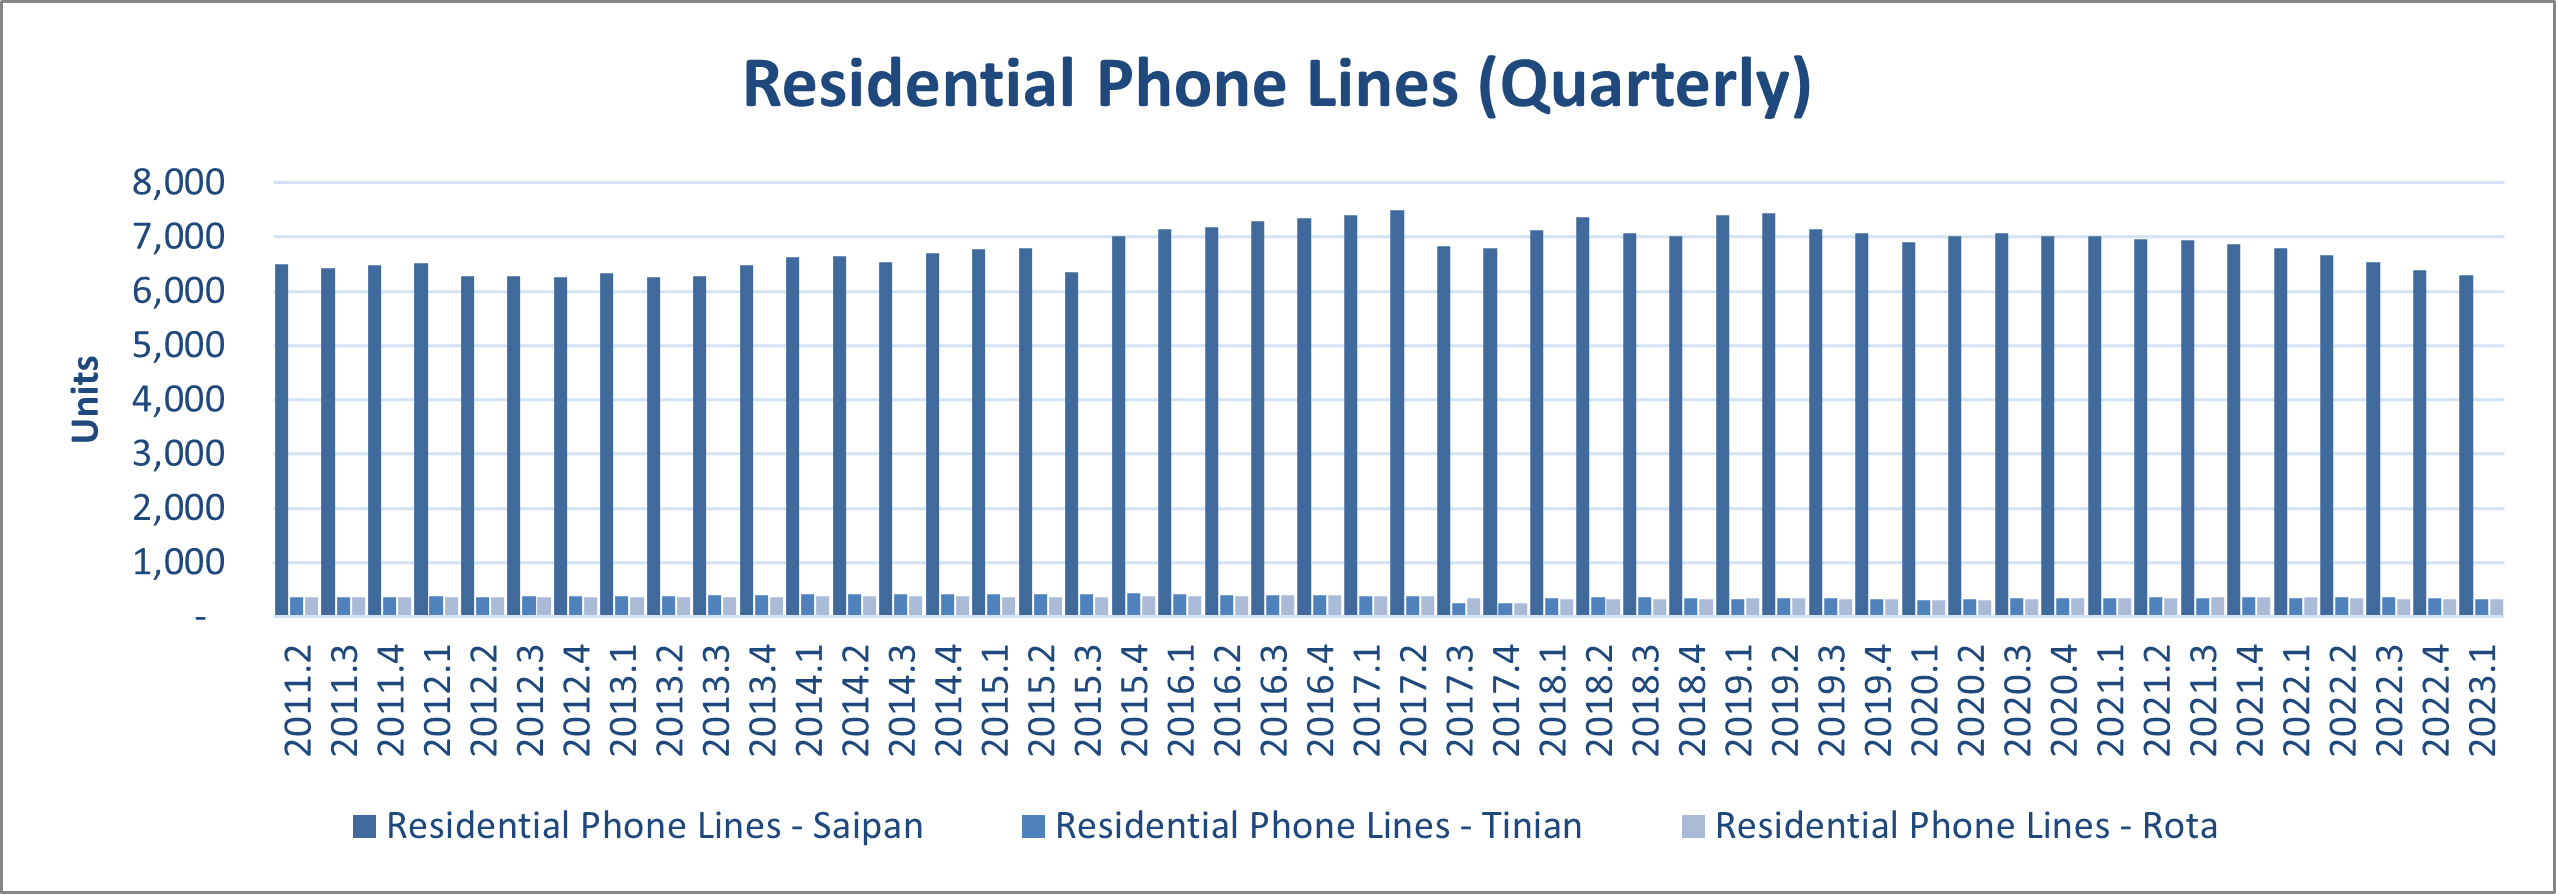
IT&E Commercial and Residential Phone Lines (Quarterly)
IT&E Commercial and Residential Phone Lines Quarterly Economic Indicator
Source: Island Telecom & Engineering (IT&E)
| Total Phone Lines | % Change from Previous Year |
Commercial Phone Lines | % Change from Previous Year |
Saipan | Tinian | Rota | Residential Phone Lines | % Change from Previous Year |
Saipan | Tinian | Rota | |
|---|---|---|---|---|---|---|---|---|---|---|---|---|
| Source: CNMI Economic Indicators / CSD | ||||||||||||
| 2023.1 | 13,247 | -0.39% | 6,309 | 1.15% | 5,789 | 284 | 236 | 6,938 | -1.76% | 6,290 | 330 | 318 |
| 2022.4 | 13,299 | -2.77% | 6,237 | -3.39% | 5,711 | 281 | 245 | 7,062 | -2.22% | 6,395 | 342 | 325 |
| 2022.3 | 13,678 | -1.41% | 6,456 | -0.84% | 5,951 | 266 | 239 | 7,222 | -1.90% | 6,536 | 354 | 332 |
| 2022.2 | 13,873 | -0.05% | 6,511 | 2.05% | 6,001 | 272 | 238 | 7,362 | -1.84% | 6,657 | 357 | 348 |
| 2022.1 | 13,880 | -0.40% | 6,380 | 0.54% | 5,880 | 258 | 242 | 7,500 | -1.19% | 6,791 | 350 | 359 |
| 2021.4 | 13,936 | -0.63% | 6,346 | -0.50% | 5,838 | 260 | 248 | 7,590 | -0.75% | 6,876 | 356 | 358 |
| 2021.3 | 14,025 | -0.26% | 6,378 | -0.42% | 5,864 | 262 | 252 | 7,647 | -0.13% | 6,939 | 352 | 356 |
| 2021.2 | 14,062 | -0.38% | 6,405 | 0.02% | 5,906 | 248 | 251 | 7,657 | -0.70% | 6,952 | 354 | 351 |
| 2021.1 | 14,115 | 0.27% | 6,404 | 0.34% | 5,910 | 243 | 251 | 7,711 | 0.21% | 7,011 | 352 | 348 |
| 2020.4 | 14,077 | 5.03% | 6,382 | 12.80% | 5,894 | 240 | 248 | 7,695 | -0.65% | 7,014 | 344 | 337 |
| 2020.3 | 13,403 | -2.67% | 5,658 | -7.29% | 5,182 | 233 | 243 | 7,745 | 1.00% | 7,064 | 350 | 331 |
| 2020.2 | 13,771 | 1.41% | 6,103 | 1.01% | 5,630 | 235 | 238 | 7,668 | 1.72% | 7,019 | 333 | 316 |
| 2020.1 | 13,580 | -5.48% | 6,042 | -9.12% | 5,566 | 237 | 239 | 7,538 | -2.34% | 6,911 | 313 | 314 |
| 2019.4 | 14,367 | -0.06% | 6,648 | 1.06% | 6,189 | 223 | 236 | 7,719 | -1.01% | 7,069 | 327 | 323 |
| 2019.3 | 14,376 | -2.65% | 6,578 | -0.93% | 6,128 | 219 | 231 | 7,798 | -4.05% | 7,140 | 338 | 320 |
| 2019.2 | 14,767 | 0.35% | 6,640 | -0.12% | 6,170 | 232 | 238 | 8,127 | 0.73% | 7,446 | 344 | 337 |
| 2019.1 | 14,716 | 1.53% | 6,648 | -2.19% | 6,163 | 241 | 244 | 8,068 | 4.82% | 7,411 | 322 | 335 |
| 2018.4 | 14,494 | -0.67% | 6,797 | -0.64% | 6,318 | 240 | 239 | 7,697 | -0.70% | 7,024 | 352 | 321 |
| 2018.3 | 14,592 | -3.24% | 6,841 | -2.48% | 6,360 | 242 | 239 | 7,751 | -3.89% | 7,077 | 353 | 321 |
| 2018.2 | 15,080 | 0.83% | 7,015 | -1.92% | 6,517 | 249 | 249 | 8,065 | 3.34% | 7,372 | 361 | 332 |
| 2018.1 | 14,956 | -1.34% | 7,152 | -9.13% | 6,661 | 243 | 248 | 7,804 | 7.08% | 7,130 | 350 | 324 |
| 2017.4 | 15,159 | -1.98% | 7,871 | -2.21% | 7,193 | 345 | 333 | 7,288 | -1.74% | 6,796 | 243 | 249 |
| 2017.3 | 15,466 | 0.45% | 8,049 | 12.60% | 7,350 | 351 | 348 | 7,417 | -10.09% | 6,824 | 243 | 350 |
| 2017.2 | 15,397 | 0.70% | 7,148 | 0.49% | 6,665 | 239 | 244 | 8,249 | 0.88% | 7,486 | 381 | 382 |
| 2017.1 | 15,290 | -2.93% | 7,113 | -6.71% | 6,633 | 236 | 244 | 8,177 | 0.63% | 7,403 | 386 | 388 |
| 2016.4 | 15,751 | -0.01% | 7,625 | -0.57% | 7,145 | 232 | 248 | 8,126 | 0.53% | 7,339 | 393 | 394 |
| 2016.3 | 15,752 | -0.32% | 7,669 | -2.04% | 7,191 | 233 | 245 | 8,083 | 1.37% | 7,293 | 399 | 391 |
| 2016.2 | 15,803 | 0.11% | 7,829 | -0.15% | 7,348 | 244 | 237 | 7,974 | 0.37% | 7,188 | 399 | 387 |
| 2016.1 | 15,786 | 0.10% | 7,841 | -1.43% | 7,353 | 248 | 240 | 7,945 | 1.66% | 7,141 | 424 | 380 |
| 2015.4 | 15,770 | 5.87% | 7,955 | 2.41% | 7,444 | 258 | 253 | 7,815 | 9.65% | 7,010 | 429 | 376 |
| 2015.3 | 14,895 | -1.88% | 7,768 | 2.22% | 7,318 | 212 | 238 | 7,127 | -6.00% | 6,347 | 421 | 359 |
| 2015.2 | 15,181 | -0.20% | 7,599 | -0.72% | 7,149 | 212 | 238 | 7,582 | 0.32% | 6,802 | 421 | 359 |
| 2015.1 | 15,212 | 4.53% | 7,654 | 8.72% | 7,204 | 212 | 238 | 7,558 | 0.60% | 6,778 | 421 | 359 |
| 2014.4 | 14,553 | 1.63% | 7,040 | 0.69% | 6,492 | 275 | 273 | 7,513 | 2.52% | 6,707 | 422 | 384 |
| 2014.3 | 14,320 | -1.85% | 6,992 | -2.10% | 6,448 | 273 | 271 | 7,328 | -1.61% | 6,542 | 412 | 374 |
| 2014.2 | 14,590 | -0.35% | 7,142 | -1.09% | 6,586 | 279 | 277 | 7,448 | 0.38% | 6,650 | 418 | 380 |
| 2014.1 | 14,641 | -2.81% | 7,221 | -7.51% | 6,659 | 282 | 280 | 7,420 | 2.25% | 6,624 | 417 | 379 |
| 2013.4 | 15,064 | 2.38% | 7,807 | 1.63% | 7,199 | 306 | 302 | 7,257 | 3.20% | 6,488 | 400 | 369 |
| 2013.3 | 14,714 | 0.00% | 7,682 | -0.56% | 7,084 | 300 | 298 | 7,032 | 0.62% | 6,278 | 395 | 359 |
| 2013.2 | 14,714 | -0.86% | 7,725 | -0.57% | 7,126 | 301 | 298 | 6,989 | -1.17% | 6,252 | 383 | 354 |
| 2013.1 | 14,841 | 0.57% | 7,769 | 0.30% | 7,161 | 308 | 300 | 7,072 | 0.87% | 6,328 | 384 | 360 |
| 2012.4 | 14,757 | -0.72% | 7,746 | -1.20% | 7,141 | 306 | 299 | 7,011 | -0.19% | 6,265 | 386 | 360 |
| 2012.3 | 14,864 | 0.07% | 7,840 | -0.23% | 7,219 | 309 | 312 | 7,024 | 0.41% | 6,283 | 380 | 361 |
| 2012.2 | 14,853 | -2.19% | 7,858 | -0.92% | 7,229 | 312 | 317 | 6,995 | -3.57% | 6,269 | 370 | 356 |
| 2012.1 | 15,185 | 0.03% | 7,931 | -0.60% | 7,285 | 316 | 330 | 7,254 | 0.74% | 6,512 | 376 | 366 |
| 2011.4 | 15,180 | -0.04% | 7,979 | -0.73% | 7,331 | 314 | 334 | 7,201 | 0.74% | 6,477 | 368 | 356 |
| 2011.3 | 15,186 | -1.06% | 8,038 | -1.07% | 7,376 | 320 | 342 | 7,148 | -1.05% | 6,431 | 362 | 355 |
| 2011.2 | 15,349 | -2.14% | 8,125 | -1.73% | 7,449 | 321 | 355 | 7,224 | -2.60% | 6,492 | 368 | 364 |
| 2011.1 | 15,685 | -1.03% | 8,268 | -0.77% | 7,581 | 327 | 360 | 7,417 | -1.33% | 6,660 | 373 | 384 |
| 2010.4 | 15,849 | -0.34% | 8,332 | -0.35% | 7,638 | 333 | 361 | 7,517 | -0.33% | 6,742 | 380 | 395 |
| 2010.3 | 15,903 | -0.54% | 8,361 | -0.82% | 7,656 | 337 | 368 | 7,542 | -0.22% | 6,761 | 379 | 402 |
| 2010.2 | 15,989 | -1.33% | 8,430 | -0.85% | 7,729 | 341 | 360 | 7,559 | -1.86% | 6,744 | 403 | 412 |
| 2010.1 | 16,204 | -1.16% | 8,502 | -1.51% | 7,783 | 357 | 362 | 7,702 | -0.79% | 6,883 | 413 | 406 |
| 2009.4 | 16,395 | -0.73% | 8,632 | 0.21% | 7,913 | 356 | 363 | 7,763 | -1.76% | 6,934 | 416 | 413 |
| 2009.3 | 16,516 | -0.80% | 8,614 | -0.53% | 7,886 | 363 | 365 | 7,902 | -1.09% | 7,057 | 422 | 423 |
| 2009.2 | 16,649 | -1.10% | 8,660 | -0.49% | 7,920 | 363 | 377 | 7,989 | -1.76% | 7,131 | 419 | 439 |
| 2009.1 | 16,835 | -2.64% | 8,703 | -3.18% | 7,966 | 361 | 376 | 8,132 | -2.06% | 7,271 | 429 | 432 |
| 2008.4 | 17,292 | -1.13% | 8,989 | -0.51% | 8,238 | 366 | 385 | 8,303 | -1.79% | 7,414 | 439 | 450 |
| 2008.3 | 17,489 | -2.31% | 9,035 | -2.23% | 8,285 | 362 | 388 | 8,454 | -2.39% | 7,550 | 450 | 454 |
| 2008.2 | 17,902 | -1.17% | 9,241 | -0.93% | 8,474 | 372 | 395 | 8,661 | -1.42% | 7,756 | 448 | 457 |
| 2008.1 | 18,114 | -1.75% | 9,328 | -1.55% | 8,552 | 381 | 395 | 8,786 | -1.96% | 7,896 | 443 | 447 |
| 2007.4 | 18,437 | -1.78% | 9,475 | -1.22% | 8,689 | 376 | 410 | 8,962 | -2.37% | 8,045 | 458 | 459 |
| 2007.3 | 18,772 | -3.27% | 9,592 | -2.69% | 8,813 | 371 | 408 | 9,180 | -3.86% | 8,237 | 473 | 470 |
| 2007.2 | 19,406 | -2.54% | 9,857 | -2.22% | 9,064 | 373 | 420 | 9,549 | -2.87% | 8,578 | 485 | 486 |
| 2007.1 | 19,912 | -3.55% | 10,081 | -4.46% | 9,276 | 378 | 427 | 9,831 | -2.59% | 8,840 | 495 | 496 |
Economic Indicator
To download, right click on the chart and select “Save Image As”…