LFP MEASURES BY AGE GROUP
TOTAL POPULATION BY AGE GROUP
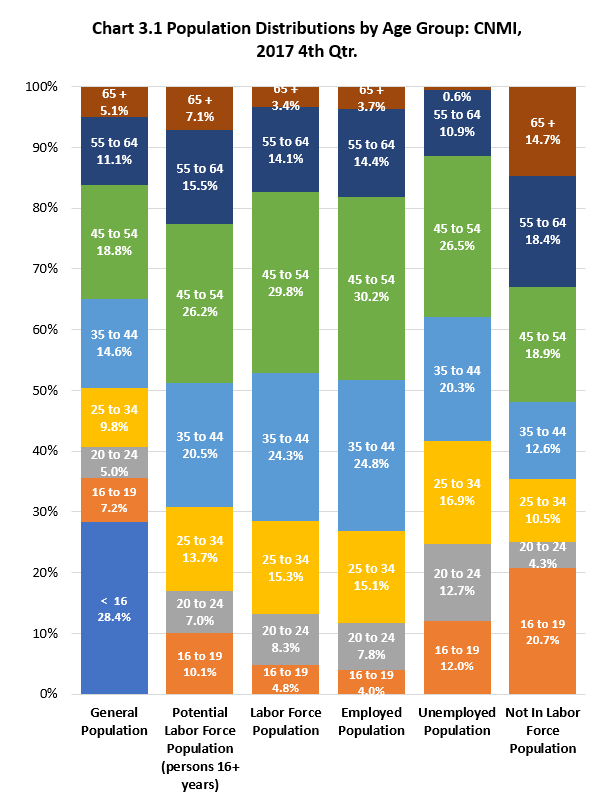
Persons less than 16 years of age comprised 28% (14,844 person) of the total population in the Commonwealth at the time of the Survey. Aside from the less than 16 group, 45 to 54 was the largest ten-year age group followed by 35 to 44, and 55 to 64, see Table 3.0 for details. (Please note that the age groups have different intervals which is suitable for looking at age from the labor force participation perspective.) The higher relative share of these age groups also reflects the presence of a relatively large foreign-worker population in the CNMI at the time of the Survey, which will become clear in the sections on citizenship and place of birth discussed later in this report.
POTENTIAL LABOR FORCE POPULATION BY AGE GROUP
The largest ten-year age group of this population was the 45–to 54 with 9,810 (26%), followed by 35 to 44 with 7,656 (21%), 16 to 24 with 6,373 (17%), 55 to 64 with 5,790 (16%), 25 to 34 with 5,136 (14%), then 65 and older with 2,654 (7%).
LABOR FORCE POPULATION BY AGE GROUP
The largest ten-year age group of the labor force population was the 45–to 54 with 7,480 (30%), followed by 35 to 44 with 6,106 (24%), 25 to 34 with 3,845 (15%), 55 to 64 with 3,529 (14%), 16 to 24 with 3,298 (13%), then 65 and older with 847 (3%).
EMPLOYED POPULATION BY AGE GROUP
The largest ten-year age group of the employed population was 45 to 54 with 6,779 (30%), followed by 35 to 44 with 5,569 (25%), 25 to 34 with 3,397 (15%), 55 to 64 with 3,241 (14%), 16 to 24 with 2,644 (12%), and 65 and older with 830 (4%). As shown in Table B.3.0 and Chart B.3.1, the age group percent distribution was similar in the employed, labor force, and potential labor force populations because of the interdependence among these populations. The employed population was 90% of the labor force population hence its age group distribution underlies the other labor force populations, namely, the labor force and the potential labor force populations.
UNEMPLOYED POPULATION BY AGE GROUP
Within the unemployed population, 45 to 54 age group was the largest with 701 (27%), followed by 16 to 24 with 655 (25%), 35 to 44 with 538 (20%), 25 to 34 with 448 (17%), 55 to 64 with 288 (11%), then 65 and older with 17 (1%). Note that the 65 and older group comprise a very small percentage (less than 1%) of the unemployed population because of retirement and other reasons such as illness.
NOT IN LABOR FORCE POPULATION BY AGE GROUP
The 16 to 24 was the largest age group within the not in the labor force population with 3,075 (25%), followed by 45 to 54 with 2,330 (19%), 55 to 64 with 2,261 (18%), 65 and older with 1,807 (15%), 35 to 44 with 1,549 (13%), then 25 to 34 with 1,291 (11%). Note that the 16 to 19 and the 65 and older had relatively higher share of the not in labor force population than in the other populations. This is because the 16 to 19 age group are more likely to be in school and the 65 and older are more likely retired or no longer active in the labor market.
UNEMPLOYMENT RATE BY AGE GROUP
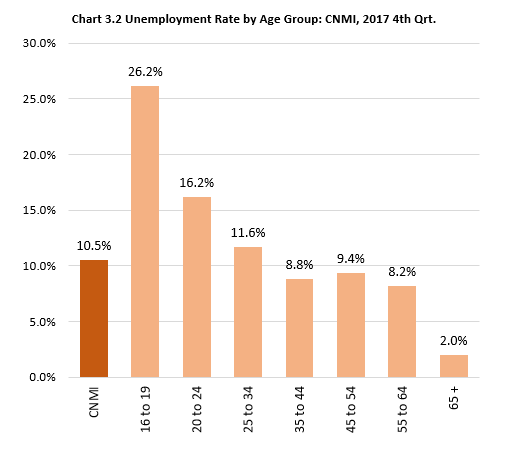
The unemployment rate is negatively associated with age group: it was highest for the 16 to 19 age group at 26.2% and lowest for the 65 and older at 2.0%. This is so mainly because in the lower age brackets, young people are more likely to be in school and have not acquired the necessary work experience or skills to get jobs quickly. From 25 through 64, most people are healthy and have acquired marketable/productive skills and more likely to be gainfully employed. Beyond 64, retirement and illness keep persons in this age group from entering or remaining the labor force.
LABOR FORCE PARTICIPATION RATE BY AGE GROUP
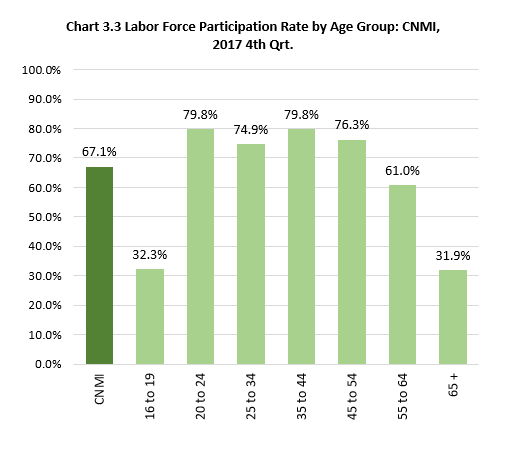
The labor force participation rate was lower in the 16 to 19 age group and in the 65 and older age group and higher among age groups in between. It was about 32% for both the 16 to 19 and 65 and older and ranged from 61% to 80% for the age groups in between. This distribution is true in economies elsewhere, not just in the CNMI. At the lower age brackets, it takes time for persons to enter the labor force population for various reasons, including going to school and lack of employable skills. On the other hand, persons 65 and older are exiting the labor force population mainly for retirement and for other reasons, such as illness. Labor force participation rate is higher in the intervening age groups where people are usually healthy and have gained skills to be gainfully employed.
LFP 2017 Table 3.0-1
Labor Force Participantion Measures by Age Group: CNMI, 2017 4th Qtr.
| Age | General Population | Potential Labor Force Population (persons 16+ years) | Labor Force Population | Employed Population | Unemployed Population | Not In Labor Force Population | Unemployment Rate | Labor Force Participation Rate |
|---|---|---|---|---|---|---|---|---|
| Source: LFP 2017 CNMI CSD | ||||||||
| Less than 16 | 14,844 | |||||||
| 16 to 19 yrs | 3,766 | 3,766 | 1,217 | 899 | 318 | 2,548 | 26.2 % | 32.3 % |
| 20 to 24 yrs | 2,608 | 2,608 | 2,081 | 1,745 | 336 | 527 | 16.2 % | 79.8 % |
| 25 to 34 yrs | 5,136 | 5,136 | 3,845 | 3,397 | 448 | 1,291 | 11.6 % | 74.9 % |
| 35 to 44 yrs | 7,656 | 7,656 | 6,106 | 5,569 | 538 | 1,549 | 8.8 % | 79.8 % |
| 45 to 54 yrs | 9,810 | 9,810 | 7,480 | 6,779 | 701 | 2,330 | 9.4 % | 76.3 % |
| 55 to 64 yrs | 5,790 | 5,790 | 3,529 | 3,241 | 288 | 2,261 | 8.2 % | 61.0 % |
| 65 and older | 2,654 | 2,654 | 847 | 830 | 17 | 1,807 | 2.0 % | 31.9 % |
LFP 2017 Table3.0-2
Labor Force Participation Measures by Age Group: CNMI, 2017 4th Qtr.
| Age | General Population | Potential Labor Force Population (persons 16+ years) | Labor Force Population | Employed Population | Unemployed Population | Not In Labor Force Population |
|---|---|---|---|---|---|---|
| Source: LFP 2017 CNMI CSD | ||||||
| < 16 | 28.4% | – | – | – | – | – |
| 16 to 19 | 7.2% | 10.1% | 4.8% | 4.0% | 12.0% | 20.7% |
| 20 to 24 | 5.0% | 7.0% | 8.3% | 7.8% | 12.7% | 4.3% |
| 25 to 34 | 9.8% | 13.7% | 15.3% | 15.1% | 16.9% | 10.5% |
| 35 to 44 | 14.6% | 20.5% | 24.3% | 24.8% | 20.3% | 12.6% |
| 45 to 54 | 18.8% | 26.2% | 29.8% | 30.2% | 26.5% | 18.9% |
| 55 to 64 | 11.1% | 15.5% | 14.1% | 14.4% | 10.9% | 18.4% |
| 65 + | 5.1% | 7.1% | 3.4% | 3.7% | 0.6% | 14.7% |
To download chart, right click on the chart and select “Save Image As”…