LFP MEASURES BY BIRTHPLACE
TOTAL POPULATION BY BIRTHPLACE
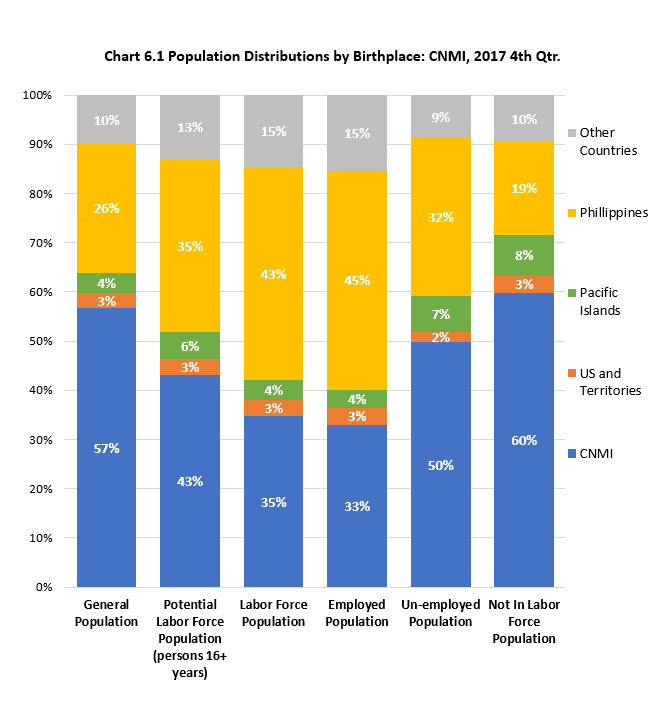
Sixty percent (60%, 31,229) of the total population in the CNMI, at the time of the Survey, was born in the US or US Territories while 36% (18,552) was born in Asian countries. Fifty seven percent (57%, 29,618) was born in the CNMI; 26% (13,661) was born in the Philippines.
POTENTIAL LABOR FORCE POPULATION BY BIRTHPLACE
Forty eight percent (48%, 17,796) of the potential labor force population in the CNMI, at the time of the Survey, was born in Asian countries while 46% (17,335) was born in the US and US Territories. Forty three percent (43%, 16,097) was born in the CNMI; 35% (13,166) was born in the Philippines.
LABOR FORCE POPULATION BY BIRTHPLACE
More than half (57%, 14,325) of the labor force population in the CNMI, at the time of the Survey, was born in Asian countries while 38% (9,547) was born in the US and Territories. Forty-three percent (43%, 10,846) was born in the Philippines; 35% (8,730) was born in the CNMI; and 8% (2,120) was born in China.
EMPLOYED POPULATION BY BIRTHPLACE
About 3 out of 5 (59%, 13,285) in the employed population was born in Asian Countries, at the time of the Survey, while 36% (8,177) was born in the US and Territories. Forty-five percent (45%, 9,995) was born in the Philippines; 33% (7,413) was born in the CNMI; and 9% (2,041) was born in China.
UNEMPLOYED POPULATION BY BIRTHPLACE
Over half (52%, 1,370) of the unemployed population was born in the US and Territories, at the time of the Survey, while 39% (1,039) was born in Asian countries. Fifty percent (50%, 1,317) was born in the CNMI; 32% (851) was born in the Philippines; and 7% (195) was born in other Pacific Islands.
NOT IN LABOR FORCE POPULATION BY BIRTHPLACE
Born in US and Territory was 63% (7,788) of the not in labor force population, at the time of the Survey. Born in Asian countries was 28% (3,471). Born in the CNMI was 60% (7,367) while born in the Philippines was 19% (2,320). Born in other Pacific Islands was 8% (1,030).
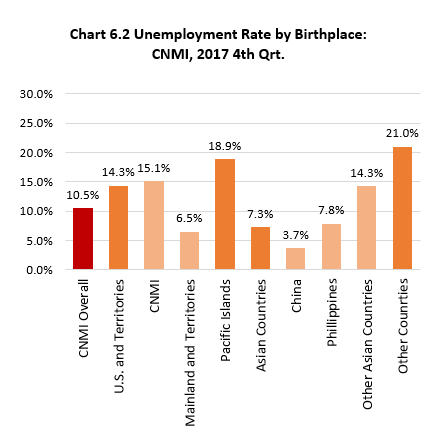
UNEMPLOYMENT RATE BY BIRTHPLACE
Born in US and Territories had unemployment rate of 14.3% while born in Asian counties was 7.3%. Born in the CNMI unemployment rate was 15.1% while born in US and Territories was 6.5%. Born in the Philippines was 7.8%, born in China was the lowest at 3.7% while born in other Pacific Islands was highest at 18.9%.
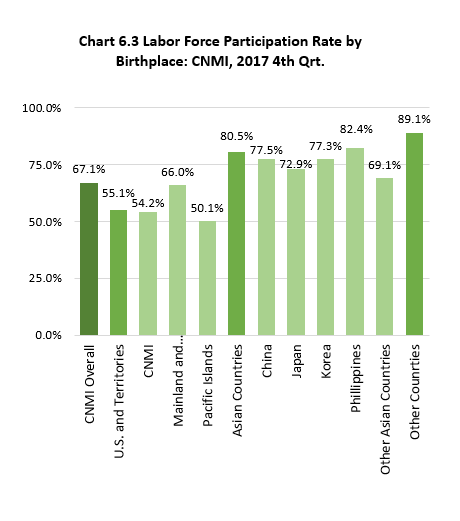
LABOR FORCE PARTICIPATION RATE BY BIRTHPLACE
Born in Asian counties had a higher labor force participation rate of 80.5% compared to born in US and Territories at 55.1%. Born in the Philippines had the highest labor force participation rate while born in the CNMI had the lowest at 54.2%.
LFP 2017 Table6.0-1
Labor Force Participation Measures by Birthplace: CNMI, 2017 4th Qtr.
| Bithplace | General Population | Potential Labor Force Population (persons 16+ years) | Labor Force Population | Employed Population | Unemployed Population | Not In Labor Force Population | Unemployment Rate | Labor Force Participation Rate |
|---|---|---|---|---|---|---|---|---|
| Source: LFP 2017 CNMI CSD | ||||||||
| US and Territories | 31,229 | 17,335 | 9,547 | 8,177 | 1,370 | 7,788 | 14.3 % | 55.1 % |
| CNMI | 29,618 | 16,097 | 8,730 | 7,413 | 1,317 | 7,367 | 15.1 % | 54.2 % |
| US and Territories | 1,611 | 1,238 | 817 | 764 | 53 | 420 | 6.5 % | 66.0 % |
| Pacific Islands | 2,167 | 2,065 | 1,035 | 840 | 195 | 1,030 | 18.9 % | 50.1 % |
| Asian Countries | 18,552 | 17,796 | 14,325 | 13,285 | 1,039 | 3,471 | 7.3 % | 80.5 % |
| China | 2,779 | 2,737 | 2,120 | 2,041 | 79 | 617 | 3.7 % | 77.5 % |
| Japan | 320 | 297 | 217 | 217 | 80 | 72.9 % | ||
| Korea | 487 | 487 | 376 | 376 | 110 | 77.3 % | ||
| Phillippines | 13,661 | 13,166 | 10,846 | 9,995 | 851 | 2,320 | 7.8 % | 82.4 % |
| Other Asian Countries | 1,305 | 1,110 | 766 | 657 | 109 | 343 | 14.3 % | 69.1 % |
| Other Counrties | 316 | 222 | 198 | 157 | 42 | 24 | 21.0 % | 89.1 % |
LFP 2017 Table6.0-2
Labor Force Participation Measures by Birthplace: CNMI, 2017 4th Qtr.
| Bithplace | General Population | Potential Labor Force Population (persons 16+ years) | Labor Force Population | Employed Population | Unemployed Population | Not In Labor Force Population |
|---|---|---|---|---|---|---|
| Source: LFP 2017 CNMI CSD | ||||||
| US and Territories | 59.8% | 46.3% | 38.0% | 36.4% | 51.8% | 63.2% |
| CNMI | 56.7% | 43.0% | 34.8% | 33.0% | 49.8% | 59.8% |
| US and Territories | 3.1% | 3.3% | 3.3% | 3.4% | 2.0% | 3.4% |
| Pacific Islands | 4.1% | 5.5% | 4.1% | 3.7% | 7.4% | 8.4% |
| Asian Countries | 35.5% | 47.6% | 57.1% | 59.2% | 39.3% | 28.2% |
| China | 5.3% | 7.3% | 8.4% | 9.1% | 3.0% | 5.0% |
| Japan | 0.6% | 0.8% | 0.9% | 1.0% | – | 0.7% |
| Korea | 0.9% | 1.3% | 1.5% | 1.7% | – | 0.9% |
| Phillippines | 26.1% | 35.2% | 43.2% | 44.5% | 32.2% | 18.8% |
| Other Asian Countries | 2.5% | 3.0% | 3.1% | 2.9% | 4.1% | 2.8% |
| Other Counrties | 0.6% | 0.6% | 0.8% | 0.7% | 1.6% | 0.2% |
To download chart, right click on the chart and select “Save Image As”…