LFP MEASURES BY CITIZENSHIP
TOTAL POPULATION BY CITIZENSHIP
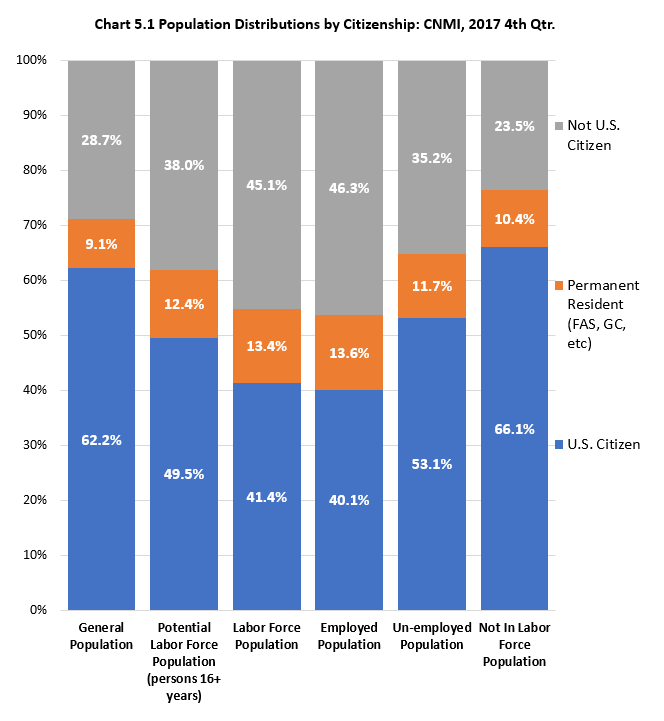
The U.S. Citizen and Permanent Resident comprised 71% (37,249) while Not U.S. Citizen was 28% (15,262) of the total population in the Commonwealth at the time of the Survey.
POTENTIAL LABOR FORCE POPULATION BY CITIZENSHIP
The U.S. Citizen and Permanent Resident made up 62% (23,185) while Not a U.S. Citizen was 38% (14,234) of the potential labor force population in the Commonwealth at the time of the Survey. The U.S. Citizen was 50% (18,541), Permanent Resident was 12% (4,644).
LABOR FORCE POPULATION BY CITIZENSHIP
The U.S. Citizen and Permanent Resident made up 55% (13,771) while Not U.S. Citizen was 45% (11,334) of the labor force population in the Commonwealth at the time of the Survey. The U.S. Citizen was 41% (10,401) while Permanent Resident was 14% (3,370).
EMPLOYED POPULATION BY CITIZENSHIP
The U.S. Citizen and Permanent Resident made up 54% (12,055) while Not U.S. Citizen was 46% (10,404) of the employed population in the Commonwealth at the time of the Survey. The U.S. Citizen was 40% (8,996) while Permanent Resident was 14% (3,060).
UNEMPLOYED POPULATION BY CITIZENSHIP
The U.S. Citizen and Permanent Resident made up 65% (1,716) while Not U.S. Citizen was 35% (930) of the unemployed population in the Commonwealth at the time of the Survey. The U.S. Citizen was 53% (1,406) while Permanent Resident was 12% (310). Note that while there are Not U.S. Citizens in the unemployed population, they are likely to be more temporary, compared to U.S Citizen and Permanent Resident, because of existing laws governing migrant workers. With no job, Not U.S. Citizen, migrant worker will eventually leave the CNMI.
NOT IN LABOR FORCE POPULATION BY CITIZENSHIP
The U.S. Citizen and Permanent Resident made up 77% (9,414) while Not U.S. Citizen was 23% (2,899) of the not in labor force population in the Commonwealth at the time of the Survey. The U.S. Citizen was 66% (8,140) while Permanent Resident was 10% (1,274). Expectedly, a lower percentage of the not in labor force population is the Not U.S. Citizen because of existing laws governing this group. Not U.S. Citizens who lose their jobs may be unemployed for a while and may even stop looking for work and become part of the not in labor force, but will have to leave the CNMI in compliance with existing laws.
UNEMPLOYMENT RATE BY CITIZENSHIP
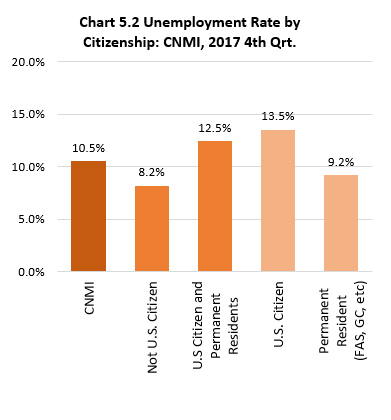
The U.S. Citizen and Permanent Resident unemployment rate was 12.5% while Not U.S. Citizen was 8.2% in the Commonwealth at the time of the Survey. The U.S. Citizen unemployment rate was 13.5% while Permanent Resident was 9.2%. Because the Not U.S. Citizen (migrant workers) entered the CNMI for employment reason, unemployment rate is expected to be lower for this group than the U.S. Citizen and Permanent Resident.
LABOR FORCE PARTICIPATION RATE BY CITIZENSHIP
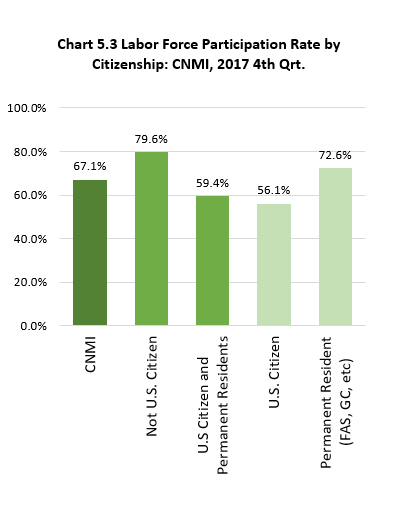
The U.S. Citizen and Permanent Resident labor force participation rate was 59.4% while Not U.S. Citizen was 79.6% in the Commonwealth at the time of the Survey. The U.S. Citizen labor force participation rate was 56.1% while Permanent Resident was 72.6%. Again, Not U.S. Citizen is expected to have a higher labor force participation rate because persons in this group came here for employment reason.
LFP 2017 Table5.0-1
Labor Force Participation Measures by Citizenship: CNMI, 2017 4th Qtr.
| Citizenship | General Population | Potential Labor Force Population (persons 16+ years) | Labor Force Population | Employed Population | Unemployed Population | Not In Labor Force Population | Unemployment Rate | Labor Force Participation Rate |
|---|---|---|---|---|---|---|---|---|
| Source: LFP 2017 CNMI CSD | ||||||||
| U.S Citizen and Permanent Residents | 37,249 | 23,185 | 13,771 | 12,055 | 1,716 | 9,414 | 12.5 % | 59.4 % |
| U.S. Citizen | 32,508 | 18,541 | 10,401 | 8,996 | 1,406 | 8,140 | 13.5 % | 56.1 % |
| Permanent Resident (FAS, GC, etc) | 4,741 | 4,644 | 3,370 | 3,060 | 310 | 1,274 | 9.2 % | 72.6 % |
| Not a U.S. Citizen | 15,014 | 14,234 | 11,334 | 10,404 | 930 | 2,899 | 8.2 % | 79.6 % |
LFP 2017 Table5.0-2
Labor Force Participation Measures by Citizenship: CNMI, 2017 4th Qtr.
| Citizenship | General Population | Potential Labor Force Population (persons 16+ years) | Labor Force Population | Employed Population | Un-employed Population | Not In Labor Force Population |
|---|---|---|---|---|---|---|
| Source: LFP 2017 CNMI CSD | ||||||
| U.S. Citizen and Permanent residents | 71.3% | 62.0% | 54.9% | 53.7% | 64.8% | 76.5% |
| U.S. Citizen and Permanent residents | 62.2% | 49.5% | 41.4% | 40.1% | 53.1% | 66.1% |
| Permenent Resident | 9.1% | 12.4% | 13.4% | 13.6% | 11.7% | 10.4% |
| Not a U.S. Citizen | 28.7% | 38.0% | 45.1% | 46.3% | 35.2% | 23.5% |
To download chart, right click on the chart and select “Save Image As”…