LFP MEASURES BY EDUCATION Place
TOTAL POPULATION BY EDUCATION PLACE
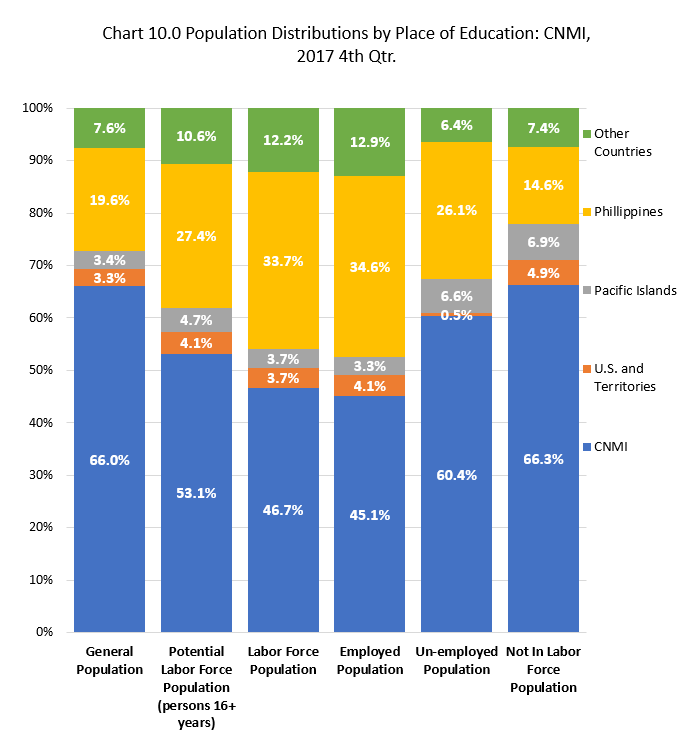
As a place of education, CNMI, US, and Territories had a 70% share while Asia was 27% of the total population in the CNMI at the time of the Survey. CNMI alone, as education place, was 66% (34,512), Philippines was 20% (10,261). Other Pacific Islands was 3% (1,765).
POTENTIAL LABOR FORCE POPULATION BY EDUCATION PLACE
The Education Place distribution changes when the less than 16 years old are excluded and we look at only 16 years old and older. CNMI, US and Territory, as education place, had 57% (21,418) of the potential labor force population while Asia was 38% (14,199) at the time of the Survey. CNMI alone had 53% (19,887) and Philippines had 27.4% (10,261).
LABOR FORCE POPULATION BY EDUCATION PLACE
CNMI, US and Territory, as Education Place, had 50% (12,659) while Asia was 46% (11,495) of the labor force population, at the time of the Survey. CNMI alone was 47% (11,729) and Philippines was 34% (8,460).
EMPLOYED POPULATION BY EDUCATION PLACE
About half (49%, 11,048) of the employed population obtained their highest level of education in the CNMI, U.S. and Territory at the time of Survey. Forty-seven (47%, 10,636) got their education from Asia. Only about 4% (744) got theirs from other Pacific Islands. Forty five percent (45%, 10,131) got theirs from the CNM an and 37% (7,770) received theirs from the Philippines. The shift in relative share towards Asia, and Philippines in particular, reflects the presence of the large migrant worker population in the CNMI. Again, because the employed population is a large proportion of the other populations, its education place proportions underlie the other labor force populations, as shown in Table B.10.0 and Chart B.10.1.
UNEMPLOYED POPULATION BY EDUCATION PLACE
Sixty one percent (61%, 1,598) of the unemployed population get their education from the CNM, US, or Territories while 33% (860) got theirs from Asia. Sixty percent (60%, 8,159) got theirs from the CNM alone an and 33% (860) received theirs from the Philippines.
NOT IN LABOR FORCE POPULATION BY EDUCATION PLACE
Seventy one percent (71%, 8,759) of the not in labor force population got their education from the CNM, US, or Territories while 22% (2,702) got theirs from Asia. Sixty six percent (66%, 8,159) got theirs from the CNM alone and 15% (1,801) got theirs from the Philippines.
UNEMPLOYMENT RATE BY EDUCATION PLACE
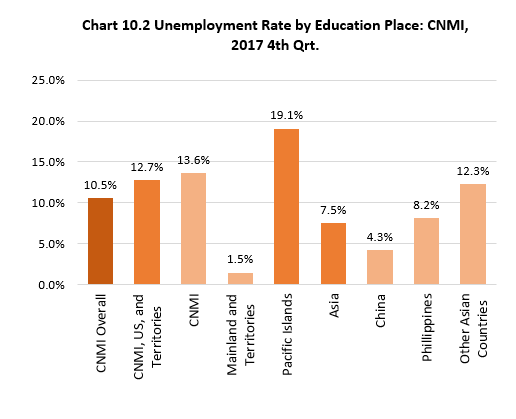
Unemployment rate was lower for the group that got their education from Asia (7.5%) compared to the group that got their education from CNMI, US, and Territories (12.7%). Those who got their education from US and Territories—excluding CNMI—had the lowest unemployment rate of 1.5%, followed by those who got theirs from China (4.3%), and from the Philippines (8.2%). From the CNMI had the second highest level of unemployment rate. (13.6%) while from the other Pacific Islands had the highest level of unemployment rate (19.1%).
LABOR FORCE PARTICIPATION RATE BY EDUCATION PLACE
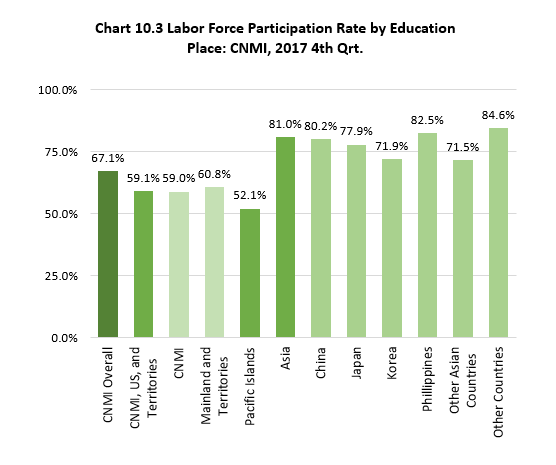
Labor force participation rate was higher for Asia (81%), as Education Place, compared to CNMI, U.S. and Territories (59%), at the time of the Survey. It was highest for the group from the Philippines (82.5%), followed by those from China (80%), from Japan (77.9%, from Korea (71.9), from U.S. or Territories—excluding CNMI—was 60.8%, and from the CNMI was 59.0%.
LFP Table10.0-1
Labor Force Participation Measures by Education Place: CNMI, 2017 4th Qtr.
| Place of Education | General Population | Potential Labor Force Population (persons 16+ years) | Labor Force Population | Employed Population | Unemployed Population | Not In Labor Force Population | Unemployment Rate | Labor Force Participation Rate |
|---|---|---|---|---|---|---|---|---|
| Source: LFP 2017 CNMI CSD | ||||||||
| CNMI, US, and Territories | 36,262 | 21,418 | 12,659 | 11,048 | 1,611 | 8,759 | 12.7 % | 59.1 % |
| CNMI | 34,512 | 19,887 | 11,729 | 10,131 | 1,598 | 8,159 | 13.6 % | 59.0 % |
| U.S. and Territories | 1,750 | 1,531 | 930 | 917 | 14 | 601 | 1.5 % | 60.8 % |
| Pacific Islands | 1,765 | 1,765 | 919 | 744 | 175 | 846 | 19.1 % | 52.1 % |
| Asia | 14,199 | 14,199 | 11,496 | 10,636 | 860 | 2,702 | 7.5 % | 81.0 % |
| China | 2,310 | 2,310 | 1,853 | 1,774 | 79 | 458 | 4.3 % | 80.2 % |
| Japan | 278 | 278 | 217 | 217 | 61 | 77.9 % | ||
| Korea | 324 | 324 | 233 | 233 | 91 | 71.9 % | ||
| Phillippines | 10,261 | 10,261 | 8,460 | 7,770 | 691 | 1,801 | 8.2 % | 82.5 % |
| Other Asian Countries | 1,025 | 1,025 | 733 | 643 | 90 | 292 | 12.3 % | 71.5 % |
| Other Countries | 37 | 37 | 31 | 31 | 6 | 84.6 % |
LFP 2017 Table10.0-2
Labor Force Participation Measures by Education Place: CNMI, 2017 4th Qtr.
| Place of Education | General Population | Potential Labor Force Population (persons 16+ years) | Labor Force Population | Employed Population | Un-employed Population | Not In Labor Force Population |
|---|---|---|---|---|---|---|
| Source: LFP 2017 CNMI CSD | ||||||
| CNMI, US, and Territories | 69.4% | 57.2% | 50.4% | 49.2% | 60.9% | 71.1% |
| CNMI, US, and Territories | 66.0% | 53.1% | 46.7% | 45.1% | 60.4% | 66.3% |
| U.S. and Territories | 3.3% | 4.1% | 3.7% | 4.1% | 0.5% | 4.9% |
| Paficic Islands | 3.4% | 4.7% | 3.7% | 3.3% | 6.6% | 6.9% |
| Asia | 27.2% | 37.9% | 45.8% | 47.4% | 32.5% | 21.9% |
| China | 4.4% | 6.2% | 7.4% | 7.9% | 3.0% | 3.7% |
| Japan | 0.5% | 0.7% | 0.9% | 1.0% | – | 0.5% |
| Korea | 0.6% | 0.9% | 0.9% | 1.0% | – | 0.7% |
| Phillippines | 19.6% | 27.4% | 33.7% | 34.6% | 26.1% | 14.6% |
| Other Asian Countries | 2.0% | 2.7% | 2.9% | 2.9% | 3.4% | 2.4% |
| Other Countries | 0.1% | 0.1% | 0.1% | 0.1% | – | 0.0% |
To download chart, right click on the chart and select “Save Image As”…