LFP MEASURES BY ETHNIC GROUP
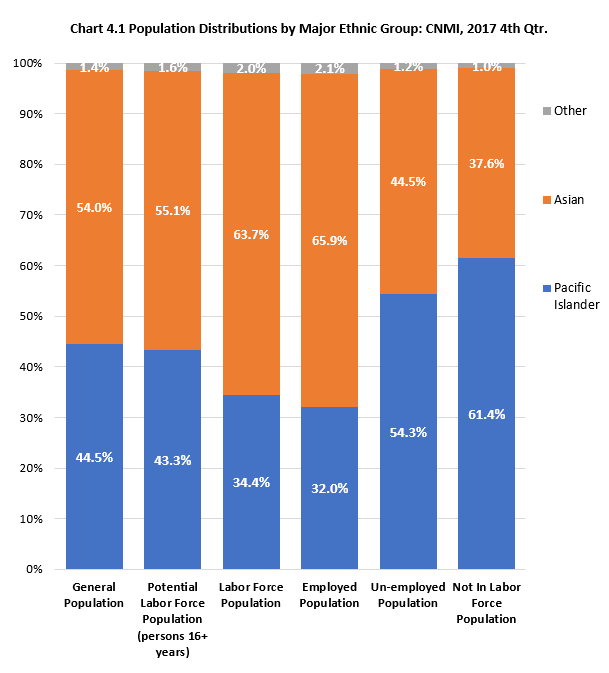
TOTAL POPULATION BY MAJOR ETHNIC GROUP
Asian was the largest major ethnic group with 54% (28,240) of the CNMI’s total population at the time of the Survey. It was followed by Pacific Islander with 45% (23,267), then Caucasian at 1% (574). Chamorro and Carolinian was 36% (18,564) and made up the clear majority of the Pacific Islander. Filipino was 41% (21,537) of the total population and was the largest single ethnic, as well as the largest of the Asian ethnic group.
POTENTIAL LABOR FORCE POPULATION BY MAJOR ETHNIC GROUP
Asian was the largest major ethnic group at 55% (20,607), with Filipino being the largest (42%, 15,681) among Asians within the potential labor force population. Chinese was the second largest among Asians. Pacific islander with 43% (16,195) was the second largest major ethnic, most of which was Chamorro and Carolinian (28%, 13,112). Micronesian was the second among the Pacific Islander at about 9% (4,503) of the potential labor force population, at the time of the Survey.
LABOR FORCE POPULATION BY MAJOR ETHNIC GROUP
Asians made up 64% (15,980) of the labor force population in the Commonwealth at the time of the Survey, while Pacific Islander was 34% (8,629). Filipino was the largest single ethnic at 49% (12,357), followed by Chamorro and Carolinian (28%, 6,953), Chinese (8%, 2,159) and Micronesian (6%, 1,588).
EMPLOYED POPULATION BY MAJOR ETHNIC GROUP
Asian comprised 66% of the employed population, at the time of the Survey while Pacific Islander made up 32%. Filipino was the largest single ethnic at 50% (11,388). Chamorro and Carolinian was 26% (5,788), Chinese was 9% (2,080) and Micronesian was 6% (1,336).
UNEMPLOYED POPULATION BY MAJOR ETHNIC GROUP
Pacific Islander was 54% (1,437) of the unemployed population at the time of the Survey while Asian was 45% (1,178). Chamorro and Carolinian was 44% (1,166), Filipino was 37% (969), Micronesian was 10% (253), and Chinese was (3% (79).
NOT IN LABOR FORCE POPULATION BY MAJOR ETHNIC GROUP
Pacific Islander was 61% (7,566) of the not in labor force population, at the time of the Survey, while Asian was 38% (4,628). Chamorro and Carolinian was 50% (6,159), Filipino was 27% (3,324), Micronesian was 11% (1,407), and Chinese was 6% (717).
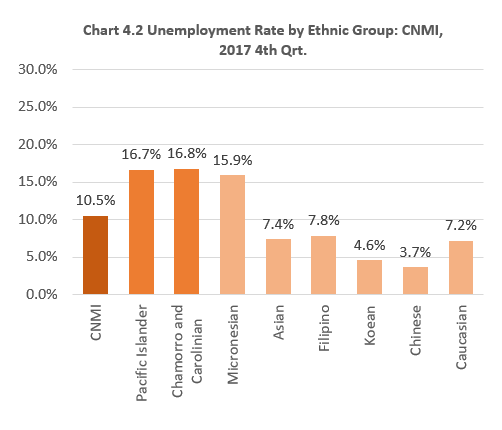
UNEMPLOYMENT RATE BY MAJOR ETHNIC GROUP
Pacific Islander unemployment rate was 16.7% while Asian was 7.4%. Chamorro and Carolinian unemployment rate was 16.8%, Micronesian was 15.9%, Filipino was 7.8%, and Chinese was 3.7%.
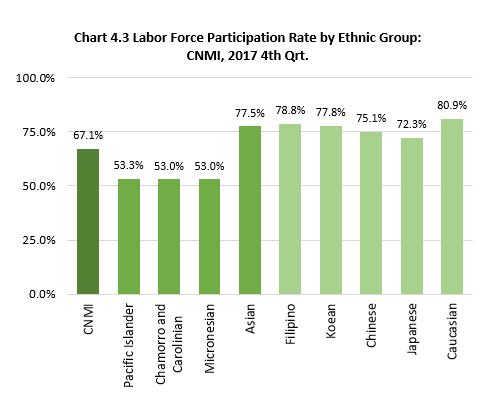
LABOR FORCE PARTICIPATION RATE BY MAJOR ETHNIC GROUP
Asian labor force participation rate was 77.5%, at the time of the Survey, while Pacific Islander was 53.3%. Caucasian had the highest labor force participation rate at 80.9%, followed by Filipino (78.8%), Korean (77.8%), Chinese (75.1%), and Japanese (72.3%). Chamorro and Carolinian and Micronesian had the same labor force participation rate at 53.0%.
LFP 2017 Table4.0-1
Labor Force Participation Measures by Ethnic Group: CNMI, 2017 4th Qtr.
| Ethnic Group | General Population | Potential Labor Force Population (persons 16+ years) | Labor Force Population | Employed Population | Unemployed Population | Not In Labor Force Population | Unemployment Rate | Labor Force Participation Rate |
|---|---|---|---|---|---|---|---|---|
| Source: LFP 2017 CNMI CSD | ||||||||
| Pacific Islander | 23,267 | 16,195 | 8,629 | 7,193 | 1,437 | 7,566 | 16.7 % | 53.3 % |
| Chamorro and Carolinian | 18,564 | 13,112 | 6,953 | 5,788 | 1,166 | 6,159 | 16.8 % | 53.0 % |
| Micronesian | 4,503 | 2,995 | 1,588 | 1,336 | 253 | 1,407 | 15.9 % | 53.0 % |
| Othe Pac Islander | 200 | 88 | 88 | 69 | 19 | 21.3 % | 100.0 % | |
| Caucasian | 574 | 531 | 430 | 399 | 31 | 102 | 7.2 % | 80.9 % |
| Asian | 28,240 | 20,607 | 15,980 | 14,801 | 1,178 | 4,628 | 7.4 % | 77.5 % |
| Chinese | 3,829 | 2,876 | 2,159 | 2,080 | 79 | 717 | 3.7 % | 75.1 % |
| Japanese | 435 | 338 | 245 | 245 | 94 | 72.3 % | ||
| Koean | 757 | 584 | 455 | 434 | 21 | 129 | 4.6 % | 77.8 % |
| Filipino | 21,537 | 15,681 | 12,357 | 11,388 | 969 | 3,324 | 7.8 % | 78.8 % |
| Other Asian | 1,683 | 1,128 | 765 | 655 | 109 | 363 | 14.3 % | 67.8 % |
| Other Single | 182 | 85 | 67 | 67 | 19 | 78.2 % |
LFP 2017 Table4.0-2
Labor Force Participation Measures by Ethnic Group: CNMI, 2017 4th Qtr.
| Ethnic Group | General Population | Potential Labor Force Population (persons 16+ years) | Labor Force Population | Employed Population | Unemployed Population | Not In Labor Force Population |
|---|---|---|---|---|---|---|
| Source: LFP 2017 CNMI CSD | ||||||
| Pacific Islander | 44.50% | 43.30% | 34.40% | 32.00% | 54.30% | 61.40% |
| Chmmorro and Carolinian | 35.50% | 35.00% | 27.70% | 25.80% | 44.00% | 50.00% |
| Micronesian | 8.60% | 8.00% | 6.30% | 5.90% | 9.50% | 11.40% |
| Other pacific Islander | 0.40% | 0.20% | 0.40% | 0.30% | 0.70% | – |
| Caucasian | 1.10% | 1.40% | 1.70% | 1.80% | 1.20% | 0.80% |
| Asian | 54.00% | 55.10% | 63.70% | 65.90% | 44.50% | 37.60% |
| Chinese | 7.30% | 7.70% | 8.60% | 9.30% | 3.00% | 5.80% |
| Japanese | 0.80% | 0.90% | 1.00% | 1.10% | – | 0.80% |
| Korean | 1.40% | 1.60% | 1.80% | 1.90% | 0.80% | 1.10% |
| Filipino | 41.20% | 41.90% | 49.20% | 50.70% | 36.60% | 27.00% |
| Other Asian | 3.20% | 3.00% | 3.00% | 2.90% | 4.10% | 2.90% |
| Other Single | 0.30% | 0.20% | 0.30% | 0.30% | – | 0.20% |
To download chart, right click on the chart and select “Save Image As”…