LFP HOUSING CHARACTERISTICS BY FUEL COOKING FUEL TYPE
CNMI Total
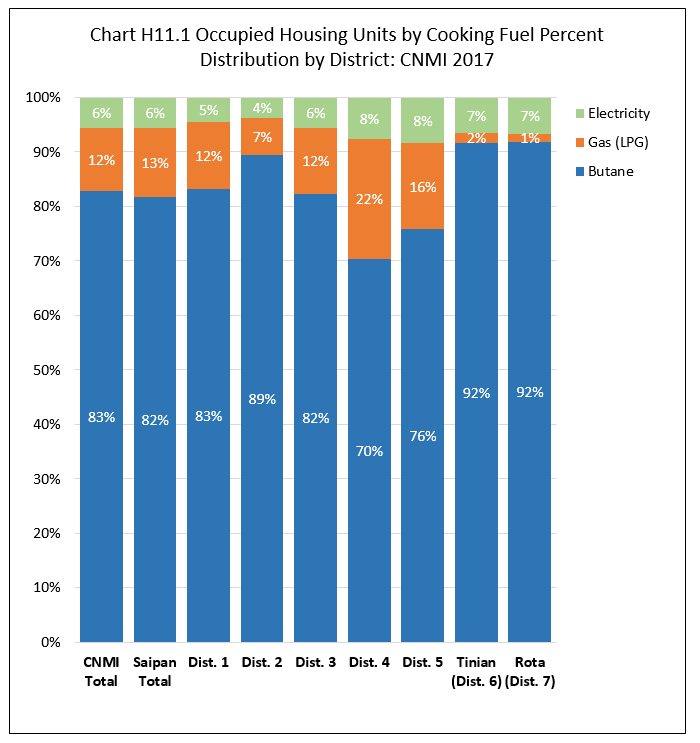
Units cooking with butane most was 82.8% of all occupied housing units in the CNMI in 2017; units cooking with LP gas most was 11.5%; and units cooking with electricity most was 5.7%.
By Island
The percentage of occupied units cooking with butane most was higher Rota (91.9%) and Tinian (91.7%) and relatively lower in Saipan (81.8%). The percentage of occupied units cooking with LP gas most was higher in Saipan (12.6%) and lower in Tinian (1.7%) and Rota (1.5%). The percentage of occupied units cooking with electricity most was slightly higher in Tinian and Rota (both 6.6%) then in Saipan (5.6%).
By Saipan Districts
Within Saipan, percentage of all units cooking with butane most was highest in District 2 (89.4%) and lowest in District 4 (70.4%). Percentage of all units cooking with LP gas most was highest in District 4 (22.0%) and was lowest in Districts 2 (6.8%). Percentage of units cooking with electricity most was highest in Districts 5 (8.4%) and lowest in District 2 (3.8%). See Chart H11.1 and Table H11.1 for detail.
Housing Characteristics
LFS 2017 Table H11.1
Labor Force Participation Measures
Table H11.1 Occupied Housing Units by Cooking Fuel, by Island, and by District: CNMI, 2017 4th Qtr.
| Saipan District 1 |
Saipan District 2 |
Saipan District 3 |
Saipan District 4 |
Saipan District 5 |
Tinian District 6 |
Rota District 7 |
||
|---|---|---|---|---|---|---|---|---|
| Source: Labor Force Survey CNMI, 2017 4th Qtr. | ||||||||
| Cooking Fuel | Electricity | 195 | 79 | 312 | 85 | 169 | 59 | 51 |
| Cooking Fuel | Gas (LPG) | 529 | 140 | 662 | 247 | 319 | 15 | 11 |
| Cooking Fuel | Butane | 3,607 | 1,833 | 4,548 | 789 | 1,531 | 825 | 703 |
| Percent within | Electricity | 4.5% | 3.8% | 5.6% | 7.6% | 8.4% | 6.6% | 6.6% |
| Percent within | Gas (LPG) | 12.2% | 6.8% | 12.0% | 22.0% | 15.8% | 1.7% | 1.5% |
| Percent within | Butane | 83.3% | 89.4% | 82.4% | 70.4% | 75.9% | 91.7% | 91.9% |
| Percent by | Electricity | 20.6% | 8.3% | 32.8% | 8.9% | 17.8% | 6.2% | 5.3% |
| Percent by | Gas (LPG) | 27.5% | 7.3% | 34.4% | 12.8% | 16.6% | 0.8% | 0.6% |
| Percent by | Butane | 26.1% | 13.2% | 32.9% | 5.7% | 11.1% | 6.0% | 5.1% |
Housing Characteristics
To download chart, right click on the chart and select “Save Image As”…