LFP MEASURES BY GENDER
TOTAL POPULATION BY GENDER
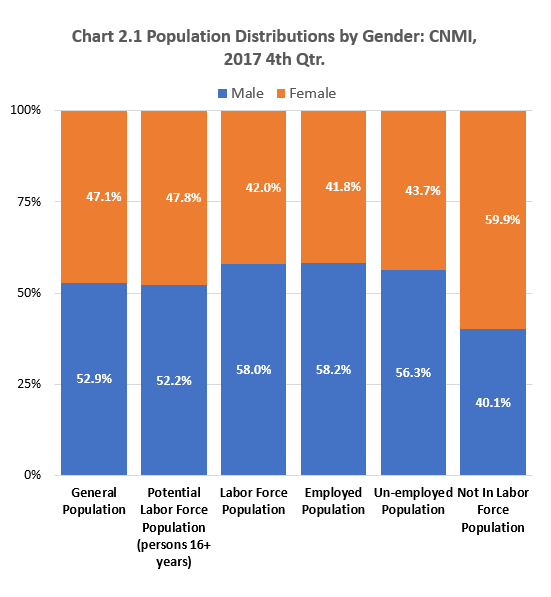
Male outnumbered female in the CNMI at the time of the Survey. An estimated 27,641 (53%) of the estimated total CNMI population was male.
POTENTIAL LABOR FORCE POPULATION BY GENDER
Like the general population, the majority (19,515, 52%) of the potential labor force population was male.
LABOR FORCE POPULATION BY GENDER
Male comprised a much higher proportion (58% or 14,571 persons) of the labor force population.
EMPLOYED POPULATION BY GENDER
Like the labor force population, male comprised 58% (13,082 person) of the employed population in the Commonwealth during the 4th Quarter, 2017. As noted earlier, it is the distribution of the employed population that influenced that of the labor force population since the employed population made up almost 90% of the labor force population at the time of the Survey.
UNEMPLOYED POPULATION BY GENDER
Male also comprised the majority (56%, 1,489) of the unemployed population in the CNMI at the time of the Survey.
NOT IN LABOR FORCE POPULATION BY GENDER
The proportion and numbers between male and female are reversed when it comes to the not-in-labor force population. Female comprised a larger share (60%, 7,370) of the not in labor force population.
UNEMPLOYMENT RATE BY GENDER
There was no significant difference in the unemployment rate between male and female, at the time of the Survey. The seeming, minor difference in Table 2.0 is not statistically significant at the 5% level of significance.
LABOR FORCE PARTICIPATION RATE BY GENDER
Male had a higher labor force participation rate (75%) than female (59%) at the time of the Survey. This fact is evident in the measures discussed previously. It is also a pattern that is true in most economies elsewhere: traditionally, a higher proportion of the male population, compared to that of female, participate, directly, in the supply of labor in the economy. Child-rearing and other traditional roles by women in the society keep some women from entering the labor force.
LFP 2017 Table2.0-1
Labor Force Participation Measures by Gender: CNMI, 2017 4th Qtr.
| Gender | General Population | Potential Labor Force Population (persons 16+ years) | Labor Force Population | Employed Population | Unemployed Population | Not In Labor Force Population | Unemployment Rate | Labor Force Participation Rate |
|---|---|---|---|---|---|---|---|---|
| Source: LFP 2017 CNMI CSD | ||||||||
| Male | 27,641 | 19,515 | 14,571 | 13,082 | 1,489 | 4,943 | 10.2 % | 74.7 % |
| Female | 24,622 | 17,904 | 10,534 | 9,378 | 1,157 | 7,370 | 11.0 % | 58.8 % |
LFP 2017 Table2.0-2
Labor Force Participantion Measures by Gender: CNMI, 2017 4th Qtr.
| Gender | General Population | Potential Labor Force Population (persons 16+ years) | Labor Force Population | Employed Population | Un-employed Population | Not In Labor Force Population |
|---|---|---|---|---|---|---|
| Source: LFP 2017 CNMI CSD | ||||||
| Male | 52.9% | 52.2% | 58.0% | 58.2% | 56.3% | 40.1% |
| Female | 47.1% | 47.8% | 42.0% | 41.8% | 43.7% | 59.9% |
To download chart, right click on the chart and select “Save Image As”…