LFP HOUSING CHARACTERISTICS BY HOME VALUE
CNMI Total
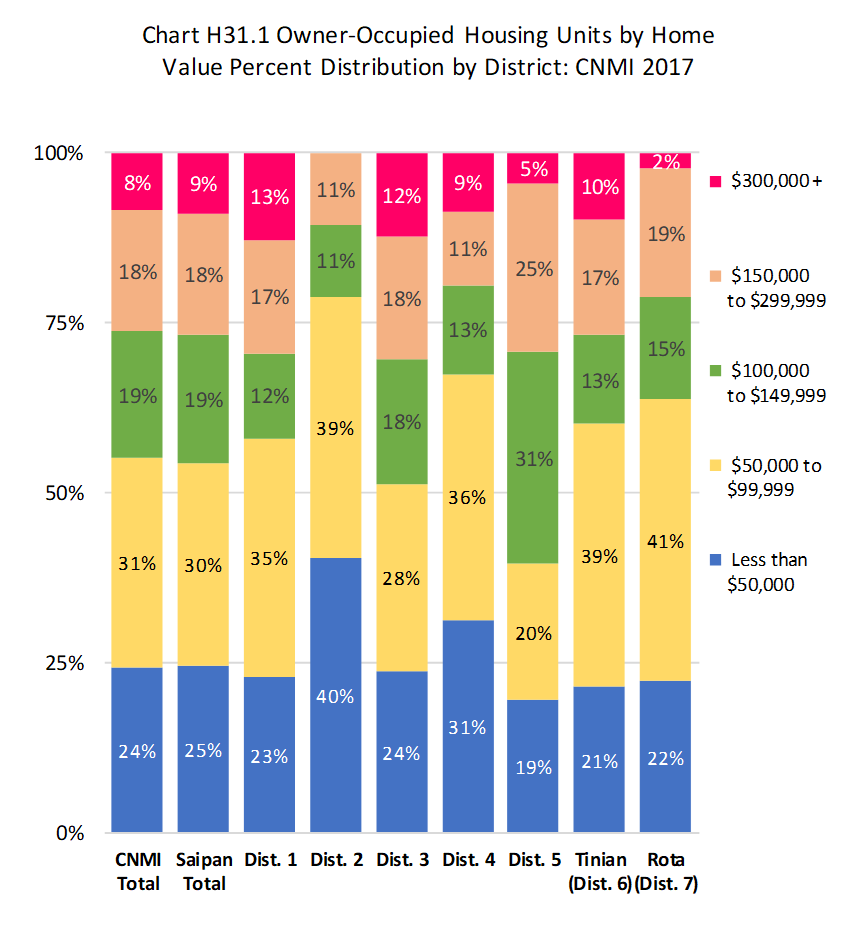
The home value median amount was $80,000 while the mean amount was $143,846 for all owner-occupied units in the CNMI in 2017. Units with a home value between $50,000 and $99,999 was the highest percentage (30.9%) of all owner-occupied units; units less than $50,000 was 24.3%; units between $100,000 and $149.999 was 18.5%; units between $150,000 and 299,999 was 17.8%; while units with $300,000 or more was 8.5%.
By Island
The home value median amount was highest in Tinian ($85,000), followed by Saipan ($80,000), then Tinian ($75,00). The mean amount was highest in Saipan ($167,276), followed by Tinian ($127,350), then Rota ($92,957). In other words, self-declared home value, in general was lower in Rota than in Saipan and Tinian. As shown, in Chart 31.1 and Table 31.1, percentage of units valued between $50,000 and $99,999 was 41.4% in Rota, 38.6% in Tinian and 29.7% in Saipan.
By Saipan Districts
Within Saipan, home value median was highest in District 5 ($100,00) and lowest in District 2 ($50,000) while the mean amount was highest in District 4 ($323,914) and lowest in District 2 ($61,500). The percentage of all units with home value less than $50,000 was highest District 2 (40.3%) and lowest in District 5 (19.5%). The percentage of all units with home values between $50,000 and $99,999 was highest District 2 (38.6%) and lowest in District 5 (20.0%). The percentage of all units with values between $100,000 and $149,999 was highest District 5 (31.4%) and lowest in District 2 (10.5%). The percentage of all units with values between $150,000 and $299,999 was highest in District 5 (24.5%) and lowest in District 2 (10.5%). The percentage of all units with values $300,000 or more was highest District 1 (12.8%) and lowest in District 2. See Chart 31.1 and Table 31.1 for more detail.
Housing Characteristics
LFS 2017 Table H31.1
Labor Force Participation Measures
Table H31.1 Occupied Housing Units by Dwelling Value, by Island, and by District: CNMI, 2017 4th Qtr.
| Saipan District 1 |
Saipan District 2 |
Saipan District 3 |
Saipan District 4 |
Saipan District 5 |
Tinian District 6 |
Rota District 7 |
||
|---|---|---|---|---|---|---|---|---|
| Source: Labor Force Survey CNMI, 2017 4th Qtr. | ||||||||
| Dwelling Value | Less than $50,000 | 292 | 80 | 202 | 243 | 211 | 39 | 89 |
| Dwelling Value | $50,000 to $99,999 | 383 | 77 | 209 | 241 | 198 | 69 | 125 |
| Dwelling Value | $100,000 to $149,999 | 116 | 42 | 161 | 82 | 310 | 24 | 51 |
| Dwelling Value | $150,000 to $299,999 | 213 | 42 | 135 | 68 | 261 | 31 | 56 |
| Dwelling Value | $300,000 + | 119 | – | 112 | 54 | 45 | 17 | 12 |
| Percent within | Less than $50,000 | 26.0% | 33.3% | 24.6% | 35.4% | 20.6% | 21.4% | 26.7% |
| Percent within | $50,000 to $99,999 | 34.1% | 31.9% | 25.5% | 35.0% | 19.3% | 38.6% | 37.6% |
| Percent within | $100,000 to $149,999 | 10.3% | 17.4% | 19.7% | 11.9% | 30.2% | 13.1% | 15.4% |
| Percent within | $150,000 to $299,999 | 19.0% | 17.4% | 16.5% | 9.9% | 25.5% | 17.1% | 16.8% |
| Percent within | $300,000 + | 10.6% | 0.0% | 13.7% | 7.9% | 4.4% | 9.6% | 3.6% |
| Percent by | Less than $50,000 | 25.3% | 6.9% | 17.5% | 21.0% | 18.3% | 3.3% | 7.7% |
| Percent by | $50,000 to $99,999 | 29.4% | 5.9% | 16.1% | 18.5% | 15.2% | 5.3% | 9.6% |
| Percent by | $100,000 to $149,999 | 14.7% | 5.3% | 20.6% | 10.4% | 39.4% | 3.0% | 6.5% |
| Percent by | $150,000 to $299,999 | 26.5% | 5.2% | 16.8% | 8.4% | 32.4% | 3.8% | 6.9% |
| Percent by | $300,000 + | 33.0% | 0.0% | 31.2% | 15.1% | 12.6% | 4.8% | 3.3% |
Housing Characteristics
To download chart, right click on the chart and select “Save Image As”…