LFP HOUSING CHARACTERISTICS BY HOT AND COLD WATER IN UNIT AND HOT WATER ENERGY TYPE
BY HOT AND COLD WATER IN UNIT
CNMI Total
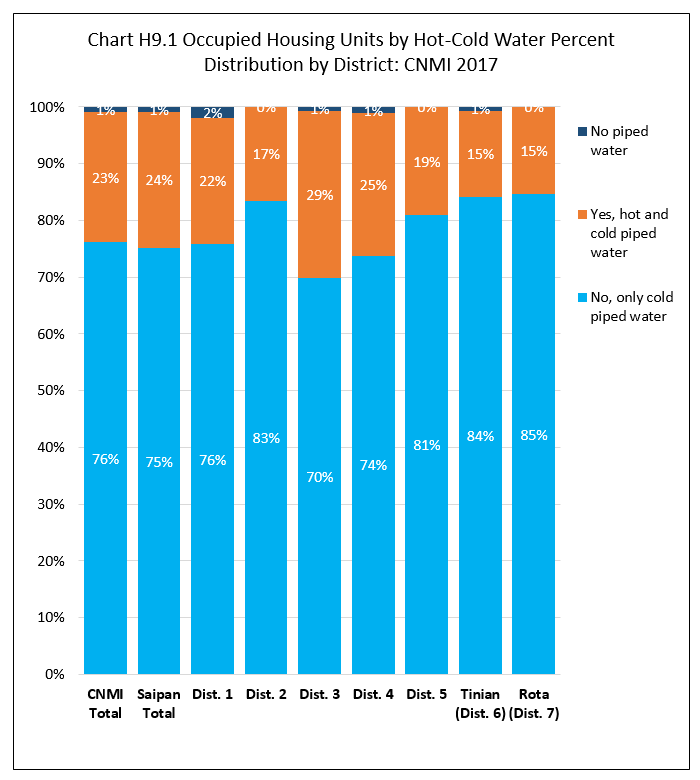
Units with only cold water was 76.1% of all occupied housing units in the CNMI in 2017; units with both hot and cold water was 23.1%; and units with no piped water was only 0.8%.
By Island
The percentage of occupied units with only cold water was higher in both Rota (84.7%) and Tinian (84.1%) and relatively lower in Saipan (75.2%). Conversely, units with both hot and cold water was relatively higher in Saipan (23.1%) and lower in Rota and Tinian (both 15.3%).
By Saipan Districts
Within Saipan, units with only cold piped water percentage was highest in District 2 (83.5%) followed by District 5 (80.9%), District 1 (75.8%) and District 4 (73.8%) and then District 3 (69.9%). Units with both hot and cold piped water percentage was highest in District 3 (29.4%), followed by District 4 (25.0%), District 1 (22.4%), District 5 (19.1%), then District 2 (16.5%). See Chart H9.1 and Table H9.1 for detail.
BY HOT WATER ENERGY TYPE
CNMI Total
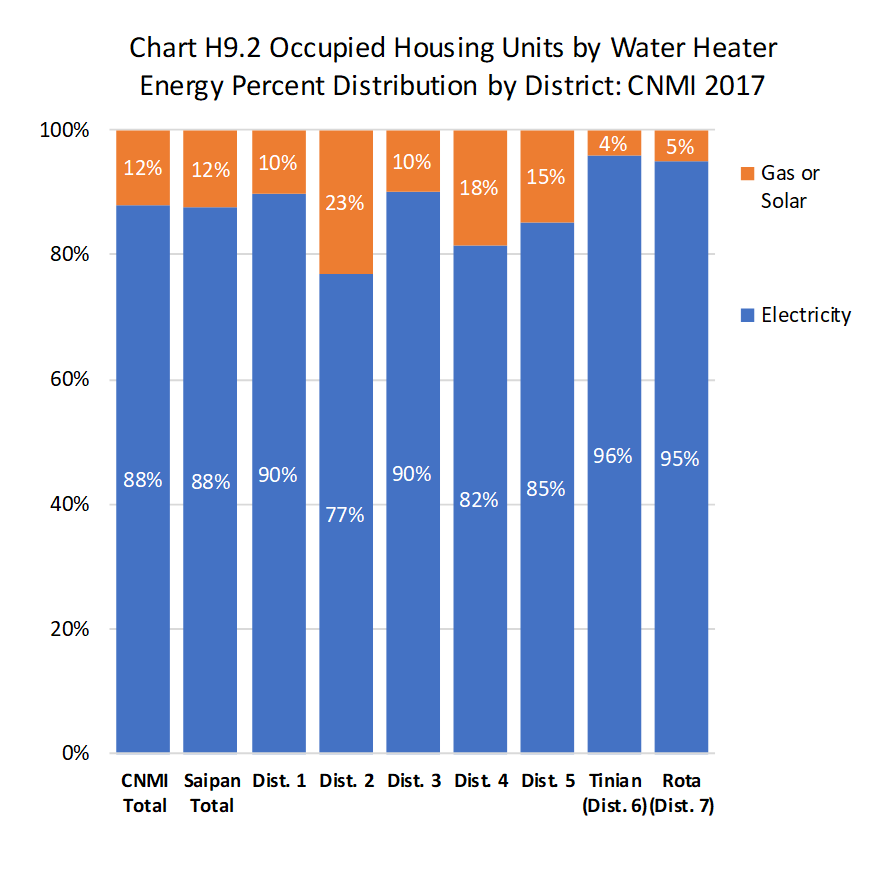
Units with electric hot water heater was 88.1% of all occupied housing units with hot water in the CNMI in 2017 while units with gas or solar water heater was 11.9%.
By Island
The percentage of units with electric hot water heater was higher in Tinian (95.8%) and Rota (94.9%) and relatively lower in Saipan (87.6%). Conversely, the percentage of units with solar or gas water heater was higher in Saipan (12.4%) and lower in Rota (5.1%) and Tinian (4.2%).
By Saipan Districts
Within Saipan, the percentage of units with electric water heater was higher in Districts 3 (90.1%) and Districts 1 (89.8%) and was lowest in District 2 (76.8%). The percentage of occupied units with gas or solar water heater was highest in District 2 (23.2%) and lowest in Districts 3 (9.9%). See Chart H9.2 and Table H9.2 for detail.
Housing Characteristics
LFS 2017 Table H9.1
Labor Force Participation Measures
Table H9.1 Occupied Housing Units by Hot and/or Cold Water, by Island, and by District: CNMI, 2017 4th Qtr.
| Saipan District 1 |
Saipan District 2 |
Saipan District 3 |
Saipan District 4 |
Saipan District 5 |
Tinian District 6 |
Rota District 7 |
||
|---|---|---|---|---|---|---|---|---|
| Source: Labor Force Survey CNMI, 2017 4th Qtr. | ||||||||
| Hot-Cold Water | Yes, hot and cold piped water | 969 | 339 | 1,625 | 281 | 385 | 137 | 117 |
| Hot-Cold Water | No, only cold piped water | 3,282 | 1,712 | 3,858 | 828 | 1,633 | 756 | 648 |
| Hot-Cold Water | No piped water | 81 | – | 40 | 13 | – | 6 | – |
| Percent within | Yes, hot and cold piped water | 22.4% | 16.5% | 29.4% | 25.0% | 19.1% | 15.3% | 15.3% |
| Percent within | No, only cold piped water | 75.8% | 83.5% | 69.9% | 73.8% | 80.9% | 84.1% | 84.7% |
| Percent within | No piped water | 1.9% | 0.0% | 0.7% | 1.1% | 0.0% | 0.6% | 0.0% |
| Percent by | Yes, hot and cold piped water | 25.2% | 8.8% | 42.2% | 7.3% | 10.0% | 3.6% | 3.0% |
| Percent by | No, only cold piped water | 25.8% | 13.5% | 30.3% | 6.5% | 12.8% | 5.9% | 5.1% |
| Percent by | No piped water | 58.1% | 0.0% | 28.6% | 9.2% | 0.0% | 4.1% | 0.0% |
LFS 2017 Table H9.2
Labor Force Participation Measures
Table H09.2 Occupied Housing Units by Water Heater Energy, by Island, and by District: CNMI, 2017 4th Qtr.
| Saipan District 1 |
Saipan District 2 |
Saipan District 3 |
Saipan District 4 |
Saipan District 5 |
Tinian District 6 |
Rota District 7 |
|
|---|---|---|---|---|---|---|---|
| Source: Labor Force Survey CNMI, 2017 4th Qtr. | |||||||
| Electricity | 870 | 260 | 1,464 | 229 | 328 | 131 | 111 |
| Gas or Solar | 99 | 79 | 161 | 52 | 57 | 6 | 6 |
| (blank) | 3,363 | 1,712 | 3,898 | 841 | 1,633 | 762 | 648 |
Housing Characteristics
To download chart, right click on the chart and select “Save Image As”…