LFP HOUSING CHARACTERISTICS BY INTERNET
CNMI Total
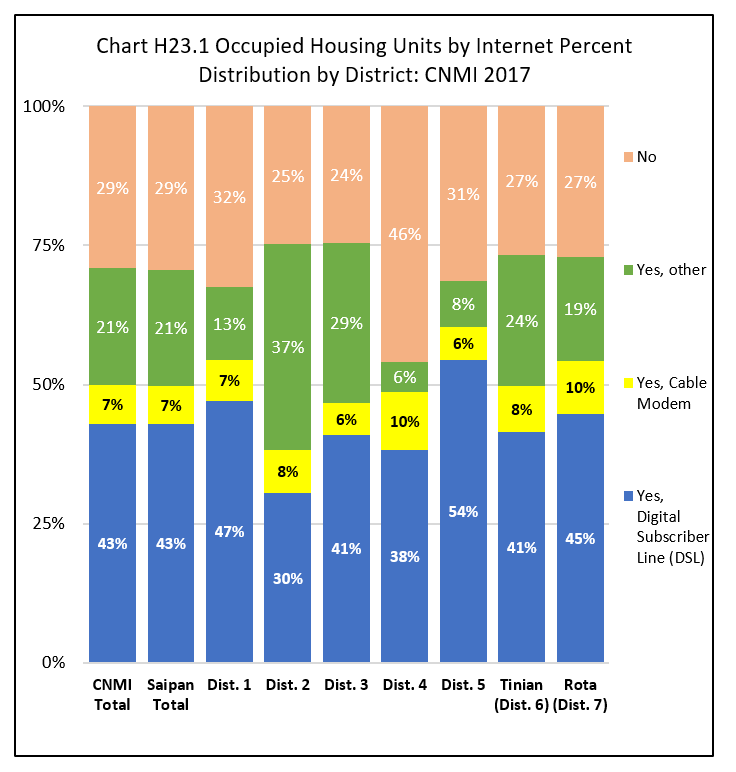
Units with Internet connection was 70.9% of all occupied housing units in the CNMI in 2017 while units with no Internet 29.1%. Units with a digital subscriber line (DSL) was 42.9% of all occupied units; units with cable modem connection was 7.1%; and units with other type of connection was 21.0%.
By Island
The percentage of units with Internet connection was slightly lower in Saipan (70.7%) than in Tinian (73.3%) and Rota (72.9%). The percentage of units with DSL connections was slightly higher in Rota (44.7%), followed by Saipan (42.9%), then Tinian (41.4%). The percentage of units with cable connections was slightly higher in Rota (9.6%) than in Tinian (8.3% and Saipan (6.8%). The percentage of units with other than DSL or Cable was slightly higher in Tinian (23.6%) than in Saipan (20.9%) and Rota (18.5%).
By Saipan Districts
Within Saipan, the percentage of all occupied units with Internet was highest in Districts 3 (75.5%) and was lowest in District 4 (54.1%). See Chart H23.1 and Table H23.1 for detail.
Housing Characteristics
LFS 2017 Table H23.1
Labor Force Participation Measures
Table H23.1 Occupied Housing Units by Internet, by Island, and by District: CNMI, 2017 4th Qtr.
| Saipan District 1 |
Saipan District 2 |
Saipan District 3 |
Saipan District 4 |
Saipan District 5 |
Tinian District 6 |
Rota District 7 |
||
|---|---|---|---|---|---|---|---|---|
| Source: Labor Force Survey CNMI, 2017 4th Qtr. | ||||||||
| Internet | Yes, Digital Subscriber Line (DSL) | 2,041 | 625 | 2,260 | 429 | 1,097 | 372 | 342 |
| Internet | Yes, Cable Modem | 315 | 161 | 316 | 116 | 122 | 75 | 74 |
| Internet | Yes, other | 571 | 758 | 1,593 | 62 | 167 | 212 | 142 |
| Internet | No | 1,405 | 508 | 1,352 | 514 | 632 | 240 | 208 |
| Percent within | Yes, Digital Subscriber Line (DSL) | 47.1% | 30.5% | 40.9% | 38.3% | 54.3% | 41.4% | 44.7% |
| Percent within | Yes, Cable Modem | 7.3% | 7.8% | 5.7% | 10.3% | 6.0% | 8.3% | 9.6% |
| Percent within | Yes, other | 13.2% | 36.9% | 28.8% | 5.5% | 8.3% | 23.6% | 18.5% |
| Percent within | No | 32.4% | 24.8% | 24.5% | 45.9% | 31.3% | 26.7% | 27.1% |
| Percent by | Yes, Digital Subscriber Line (DSL) | 28.5% | 8.7% | 31.5% | 6.0% | 15.3% | 5.2% | 4.8% |
| Percent by | Yes, Cable Modem | 26.8% | 13.6% | 26.9% | 9.8% | 10.4% | 6.3% | 6.3% |
| Percent by | Yes, other | 16.3% | 21.6% | 45.5% | 1.8% | 4.8% | 6.1% | 4.0% |
| Percent by | No | 28.9% | 10.5% | 27.8% | 10.6% | 13.0% | 4.9% | 4.3% |
Housing Characteristics
To download chart, right click on the chart and select “Save Image As”…