LFP MEASURE BY ISLAND AND DISTRICT
TOTAL POPULATION BY ISLAND AND DISTRICT
Of the 52,263 CNMI total population, Saipan’s was 47,565 (91%), Tinian’s was 2,626 (5%), and Rota’s was 2,072 (4%). Again, please see Appendix A for detail how the populations were estimated.
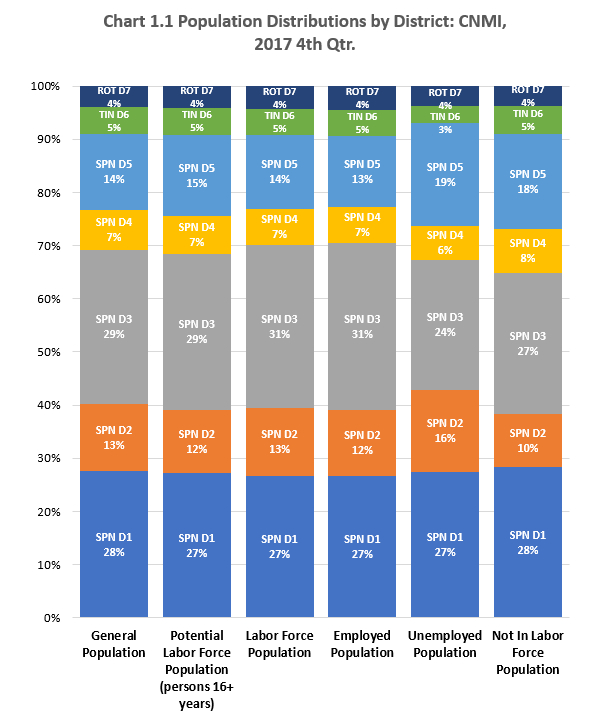
By districts, District 3 had the largest population of 15,218 (29%); followed by District 1 with 14,416 (28%), District 5 with 7,472 (24%), District 2, 6,566 (13%), and District 4 with 3,892 (7%). District 6 is the island of Tinian, and District 7 is the Island of Rota. See Table 1.0 and Chart 1.1 for details.
POTENTIAL LABOR FORCE POPULATION BY ISLAND AND DISTRICT
Of 37,419 estimated potential labor force population at the time of the Survey, 34,001 (91%) was in Saipan, 1,874 (5%) in Tinian, and 1,544 (4%) in Rota.
Within Saipan and by districts, District 3 had the largest potential labor force population of 10,961 (29%), followed by District 1 with 10,209 (27%), District 5 with 5,690 (15%), District 2 with 4,426 (12%), and District 4 with 2,714 (7%).
LABOR FORCE POPULATION BY ISLAND AND DISTRICT
Of the 25,106 estimated labor force population persons in the CNMI at the time of the Survey, 22,339 (91%) was in Saipan, 1,218 (5%) in Tinian, and 1,084 (4%) in Rota.
Within Saipan and by districts, District 3 had the largest labor force population of 7,697 (31%), followed by District 1 with 6,706 (27%), District 5 with 3,508 (14%), District 2 with 3,217 (13%), and District 4 with 1,676 (7%).
EMPLOYED POPULATION BY ISLAND AND DISTRICT
Of the 22,459 estimated employed population in the CNMI at the time of the Survey, 20,339 (91%) was in Saipan, 1,135 (5%) in Tinian, and 986 (4%) in Rota.
Within Saipan and by districts, District 3 had the largest employed population of 7,052 (31%), followed by District 1 with 5,980 (27%), District 5 with 2,992 (13%), District 2 with 2,807 (13%), and District 4 with 1,507 (7%).
UNEMPLOYED POPULATION BY ISLAND AND DISTRICT
Of the 2,646 estimated unemployed population, at the time of the Survey in the Commonwealth, 2,465 (93%) was in Saipan, 83 (3%) in Tinian and 98 (4%) in Rota.
Within Saipan and by district, District 1 had the largest unemployed population of 726 (27%), followed by District 3 with 645 (24%), District 5 with 515 (20%), District 2 with 410 (16%), and District 4 with 169 (6%).
NOT IN LABOR FORCE POPULATION BY ISLAND AND DISTRICT
Of the 12,313 estimated not in-labor force population in the CNMI in 2017 4th Quarter, 11,197 (91%) was in Saipan, 656 (5%) in Tinian, and 461 (4%) in Rota.
Within Saipan and by districts, District 1 had the largest not in labor force population of 3,503 (28%), followed by District 3 with 3,264 (27%), District 5 with 2,182 (17%), District 2 with 1.210 (10%), and District 4 with 1,038 (8%).
As noted earlier, the employed population was 90% of the labor force population, while the labor force population was 67% of the potential labor force population and the potential labor force population in turn made up 72% of the general population. The interdependencies is the main reason the percent distribution of the employed, labor force, potential labor force, and the general populations are similar, as shown Table B.1.0 and Chart B.1.1. For example, by island, Saipan comprised 91% of the general population; Tinian, 5%; and Rota, 4%. This percent distribution is the same in all labor force populations. The same is true with percent distribution by district. By district, District 3 had the highest share, followed by District 1, District 5, District 2, and then District 4 had the lowest share in all population except for the unemployed and the not in labor force populations. In these last two, District 1 had the highest share, followed by District 3, District 5, District 2, then District 4.
UNEMPLOYMENT RATE BY ISLAND AND DISTRICT
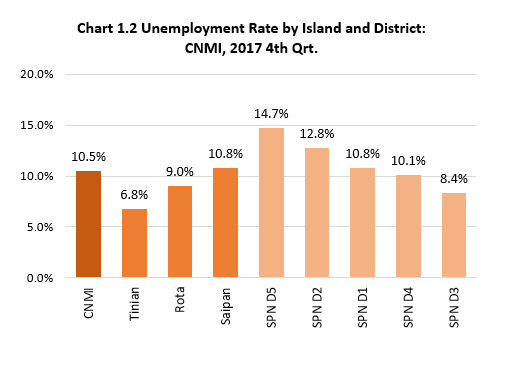
The unemployment rate was highest in Saipan at 10.8%, followed by Rota at 9.0%, then Tinian at 6.8%.
Within Saipan and by district, District 5 had the highest unemployment rate of 14.7%, followed by District 2 at 12.8%, District 1 at 10.8%, District 4 at 10.1%, and District 3 at 8.4%.
LABOR FORCE PARTICIPATION RATE BY ISLAND AND DISTRICT
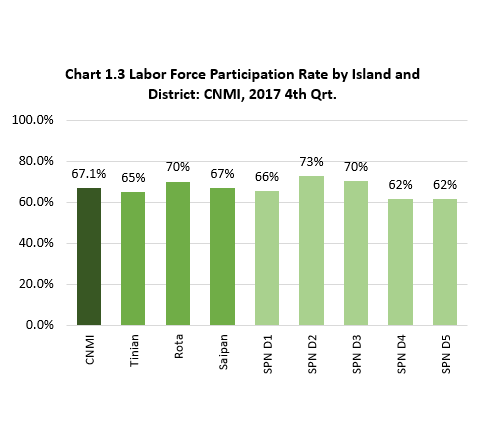
In the 4th Quarter of 2017, the labor force participation rate in the CNMI was highest in Rota 70.2%, followed by Saipan 67.1%, then Tinian at 65.0%.
Within Saipan and by district, District 2 had the highest LFP rate of 72.7%, followed by District 3 at 70.2%, District 1 at 65.7%, while District 4 and 5 had similar LFP rate at 62%.
LFP 2017 Table1.0-1
Labor Force Participantion Measures by Island and District: CNMI, 2017 4th Qtr.
| Island | District | General Population | Potential Labor Force Population (persons 16+ years) | Labor Force Population | Employed Population | Unemployed Population | Not In Labor Force Population | Unemployment Rate | Labor Force Participation Rate |
|---|---|---|---|---|---|---|---|---|---|
| Source: LFP 2017 CNMI CSD | |||||||||
| Saipan | District 1 | 14,416 | 10,209 | 6,706 | 5,980 | 726 | 3,503 | 10.8 % | 65.7 % |
| Saipan | District 2 | 6,566 | 4,426 | 3,217 | 2,807 | 410 | 1,210 | 12.8 % | 72.7 % |
| Saipan | District 3 | 15,218 | 10,961 | 7,697 | 7,052 | 645 | 3,264 | 8.4 % | 70.2 % |
| Saipan | District 4 | 3,892 | 2,714 | 1,676 | 1,507 | 169 | 1,038 | 10.1 % | 61.7 % |
| Saipan | District 5 | 7,472 | 5,690 | 3,508 | 2,992 | 515 | 2,182 | 14.7 % | 61.6 % |
| Tinian | District 6 | 2,626 | 1,874 | 1,218 | 1,135 | 83 | 656 | 6.8 % | 65.0 % |
| Rota | District 7 | 2,072 | 1,544 | 1,084 | 986 | 98 | 461 | 9.0 % | 70.2 % |
LFP 2017 Table1.0-2
Labor Force Participation Measures by Island and District: CNMI, 2017 4th Qtr.
| District | General Population | Potential Labor Force Population (persons 16+ years) | Labor Force Population | Employed Population | Unemployed Population | Not In Labor Force Population |
|---|---|---|---|---|---|---|
| Source: LFP 2017 CNMI CSD | ||||||
| SPN D1 | 28% | 27% | 27% | 27% | 27% | 28% |
| SPN D2 | 13% | 12% | 13% | 12% | 16% | 10% |
| SPN D3 | 29% | 29% | 31% | 31% | 24% | 27% |
| SPN D4 | 7% | 7% | 7% | 7% | 6% | 8% |
| SPN D5 | 14% | 15% | 14% | 13% | 19% | 18% |
| TIN D6 | 5% | 5% | 5% | 5% | 3% | 5% |
| ROT D7 | 4% | 4% | 4% | 4% | 4% | 4% |
To download chart, right click on the chart and select “Save Image As”…