LFP HOUSING CHARACTERISTICS BY LANDLINE
DescriptionTable DataCharts and Figures Data
CNMI Total
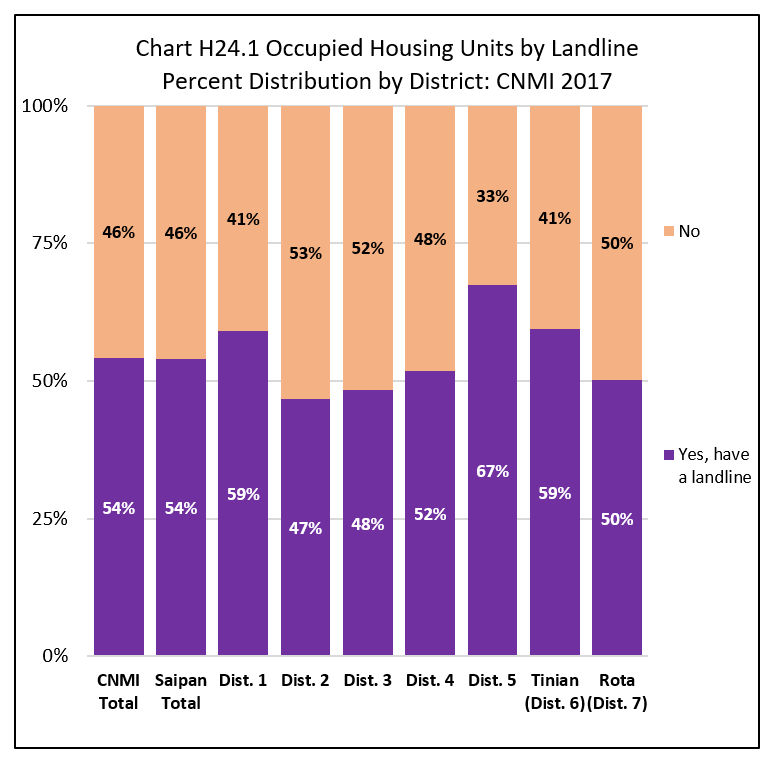
Units with a landline was 54.2% of all occupied housing units in the CNMI in 2017 while units with no landline was 45.8%.
By Island
The percentage of occupied units with a landline was higher in Tinian (59.5%), followed by Saipan (54.1%), then Rota (49.5%).
By Saipan Districts
Within Saipan, the percentage of all occupied units with a landline was highest in Districts 5 (67.4%) and was lowest in District 2 (46.8%). See Chart H24.1 and Table H24.1 for detail.
Housing Characteristics
LFS 2017 Table H24.1
Labor Force Participation Measures
Table H24.1 Occupied Housing Units by Landline, by Island, and by District: CNMI, 2017 4th Qtr.
| Saipan District 1 |
Saipan District 2 |
Saipan District 3 |
Saipan District 4 |
Saipan District 5 |
Tinian District 6 |
Rota District 7 |
||
|---|---|---|---|---|---|---|---|---|
| Source: Labor Force Survey CNMI, 2017 4th Qtr. | ||||||||
| Landline | Yes, have a landline | 2,559 | 960 | 2,676 | 581 | 1,361 | 535 | 384 |
| Landline | No | 1,773 | 1,091 | 2,846 | 541 | 658 | 364 | 380 |
| Percent within | Yes, have a landline | 59.1% | 46.8% | 48.5% | 51.8% | 67.4% | 59.5% | 50.3% |
| Percent within | No | 40.9% | 53.2% | 51.5% | 48.2% | 32.6% | 40.5% | 49.7% |
| Percent by | Yes, have a landline | 28.3% | 10.6% | 29.6% | 6.4% | 15.0% | 5.9% | 4.2% |
| Percent by | No | 23.2% | 14.3% | 37.2% | 7.1% | 8.6% | 4.8% | 5.0% |
Housing Characteristics
To download chart, right click on the chart and select “Save Image As”…