LFP MEASURES BY LANGUAGE
TOTAL POPULATION BY LANGUAGE
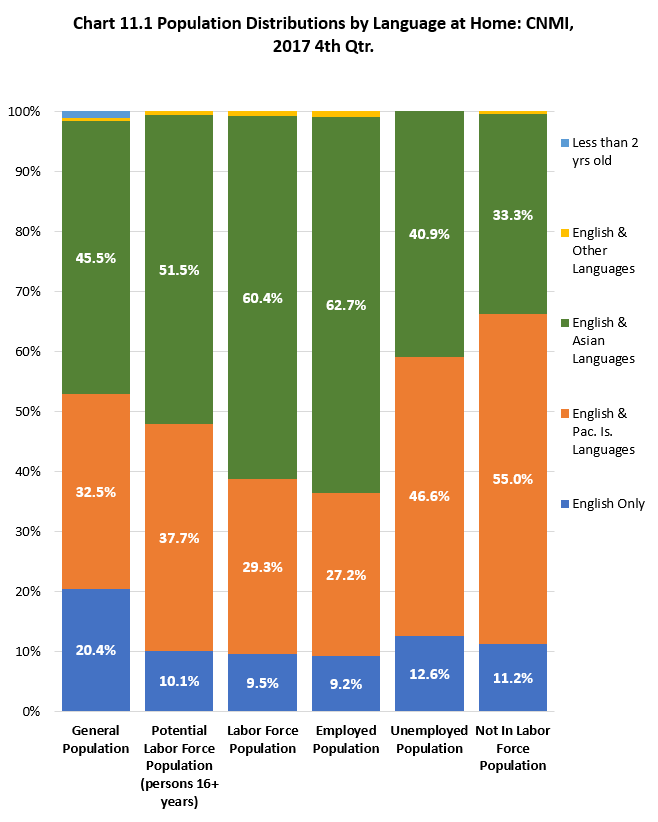
Twenty percent (20%, 10,658) of the estimated total population spoke English only at home while 79% (41,069) spoke English and another language at the time of the Survey. Forty six percent (46%, 23,786) spoke an Asian language while 33% (17,005) spoke a Pacific Islander language at home. One percent (1, 536) of the total population was less than 2 years old.
POTENTIAL LABOR FORCE POPULATION BY LANGUAGE
Ninety percent (90%, 33,645) of the potential labor force population spoke English and another language at home while 10% (3,774) spoke English only at home, at the time of the Survey. Over half (52%, 19,278) in the potential labor force population spoke English and an Asian language at home while 38% (14,119) spoke English and a Pacific Islander language.
LABOR FORCE POPULATION BY LANGUAGE
Ninety one percent (91%, 22,716) of the labor force population spoke English and another language at home while 9% (2,390) spoke only English at home, at the time of the Survey. Three of five (60%, 15,174) spoke English and an Asian language at home while 29% (7,351) spoke English and a Pacific Islander language in the labor force population.
EMPLOYED POPULATION BY LANGUAGE
Ninety one percent (91%, 20,402) of the employed population spoke English and another language at home while 9% (2,057) spoke only English, at the time of the Survey. More than three in five (63%, 11,093) spoke English and an Asian language at home while 27% (6,119) spoke English and a Pacific Islander language at home, within the employed population. The distribution of Language spoken at home in the employed population influenced the other labor force population distributions because it is inherent in them, as shown in Table B.11.0 and Chart B.11.1.
UNEMPLOYED POPULATION BY LANGUAGE
Eighty seven percent (87%, 2,313) spoke English and another language at home in the unemployed population while 13% (333) spoke only English, at the time of the Survey. Forty seven percent (47%, 1,232) spoke English and a Pacific Islander language while 41% (1,081) spoke English and an Asian language at home.
NOT IN LABOR FORCE POPULATION BY LANGUAGE
Eighty seven percent (89%, 10,930) spoke English and another language at home in the not in labor force population while 11% (1,384) spoke only English, at the time of the Survey. Fifty five percent (55%, 6,768) spoke English and a Pacific Islander language while 33% (4,104) spoke English and an Asian language at home.
UNEMPLOYMENT RATE BY LANGUAGE
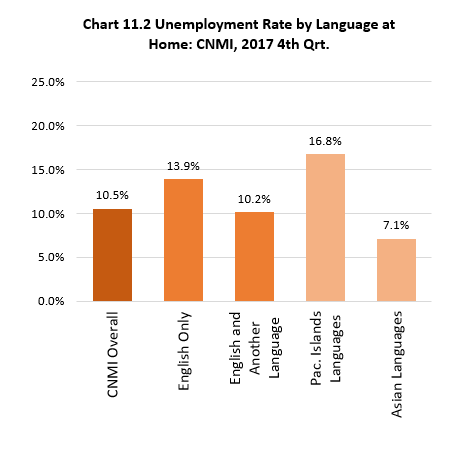
Those who spoke English only at home had a higher unemployment rate (13.9%) compared to those who spoke English and another language (10.2%), at the time of the Survey. English and Asian language group had a low unemployment rate of 7.1% while English and Pacific Islands languages group had a higher unemployment rate of 16.8%.
LABOR FORCE PARTICIPATION RATE BY LANGUAGE
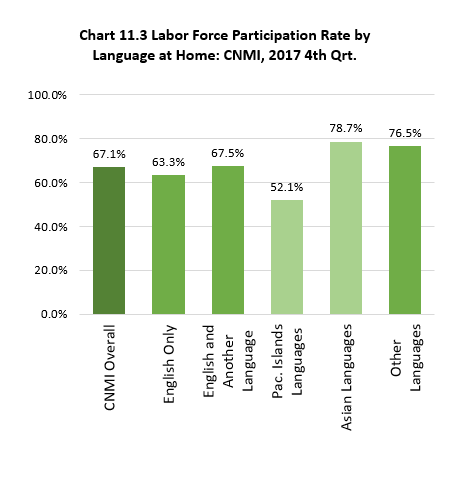
The labor force participation rate was higher (67.5%) for English only speakers at home compared to those who spoke English and another language (63.3%) at home. Persons who spoke English and an Asian language at home had a higher labor force participation rate (78.7%) than those that Spoke English and a Pacific Island Language (52.1%) at home.
LFP 2017 Table11.0-1
Labor Force Participation Measures by Language: CNMI, 2017 4th Qtr.
| Speak | General Population | Potential Labor Force Population (persons 16+ years) | Labor Force Population | Employed Population | Unemployed Population | Not In Labor Force Population | Unemployment Rate | Labor Force Participation Rate |
|---|---|---|---|---|---|---|---|---|
| Source: LFP 2017 CNMI CSD | ||||||||
| English Only | 10,658 | 3,774 | 2,390 | 2,057 | 333 | 1,384 | 13.9 % | 63.3 % |
| English | 10,658 | 3,774 | 2,390 | 2,057 | 333 | 1,384 | 13.9 % | 63.3 % |
| English and Another Language | 41,069 | 33,645 | 22,716 | 20,402 | 2,313 | 10,930 | 10.2 % | 67.5 % |
| Pac. Islands Languages | 17,005 | 14,119 | 7,351 | 6,119 | 1,232 | 6,768 | 16.8 % | 52.1 % |
| Asian Languages | 23,786 | 19,278 | 15,174 | 14,093 | 1,081 | 4,104 | 7.1 % | 78.7 % |
| Other Languages | 278 | 248 | 190 | 190 | 58 | 76.5 % | ||
| Less than 2 yrs old | 536 |
LFP 2017 Table11.0-2
Labor Force Participation Measures by Language: CNMI, 2017 4th Qtr.
| Speak | General Population | Potential Labor Force Population (persons 16+ years) | Labor Force Population | Employed Population | Un-employed Population | Not In Labor Force Population |
|---|---|---|---|---|---|---|
| Source: LFP 2017 CNMI CSD | ||||||
| English Only | 20.4% | 10.1% | 9.5% | 9.2% | 12.6% | 11.2% |
| English and Another Language | 78.6% | 89.9% | 90.5% | 90.8% | 87.4% | 88.8% |
| Pac. Islands Languages | 32.5% | 37.7% | 29.3% | 27.2% | 46.6% | 55.0% |
| Asian Languages | 45.5% | 51.5% | 60.4% | 62.7% | 40.9% | 33.3% |
| Other Languages | 0.5% | 0.7% | 0.8% | 0.8% | – | 0.5% |
| Less than 2 yrs old | 1.0% | – | – | – | – | – |
To download chart, right click on the chart and select “Save Image As”…